Invented by Trung Pham, Berta Rodriguez Hervas, Minwoo Park, David Nister, Neda CVIJETIC, Nvidia Corp
Autonomous machines, such as self-driving cars, drones, and robots, rely on advanced technologies to perceive and understand their surroundings. Intersection regions pose unique challenges due to the complexity of traffic patterns, multiple lanes, and various road users. Accurate detection and classification of intersection regions are essential to enable autonomous machines to make informed decisions and navigate safely through these areas.
One of the key technologies driving the market for intersection region detection and classification is computer vision. Computer vision algorithms analyze real-time visual data captured by cameras mounted on autonomous machines to detect and classify objects, lanes, and traffic signs within intersection regions. These algorithms utilize deep learning techniques, such as convolutional neural networks (CNNs), to process vast amounts of data and accurately identify objects and their attributes.
The market for intersection region detection and classification is witnessing significant growth due to several factors. Firstly, the increasing adoption of autonomous vehicles in transportation and logistics is driving the demand for advanced perception systems. Autonomous cars need to accurately detect and classify objects, such as pedestrians, cyclists, and other vehicles, within intersection regions to ensure safe navigation and avoid collisions.
Secondly, the rise of smart cities and infrastructure development is fueling the demand for intersection region detection and classification systems. These systems can provide valuable data to traffic management authorities, enabling them to optimize traffic flow, reduce congestion, and enhance overall road safety. By accurately detecting and classifying objects within intersection regions, autonomous machines can contribute to the development of efficient and intelligent transportation systems.
Furthermore, the growing investments in research and development activities by technology companies and automotive manufacturers are driving innovation in intersection region detection and classification. Companies are investing in developing advanced computer vision algorithms, sensor fusion techniques, and machine learning models to enhance the accuracy and reliability of these systems. This investment is expected to further propel the market growth in the coming years.
However, there are challenges that need to be addressed for the widespread adoption of intersection region detection and classification systems. One of the key challenges is the need for robust and reliable algorithms that can handle various weather conditions, lighting conditions, and occlusions. Autonomous machines must be able to accurately detect and classify objects within intersection regions regardless of environmental factors.
Additionally, ensuring the privacy and security of the data collected by these systems is another challenge. Intersection region detection and classification systems generate a vast amount of data that needs to be processed and transmitted securely. Companies and authorities need to implement robust data protection measures to prevent unauthorized access and misuse of this data.
In conclusion, the market for intersection region detection and classification for autonomous machine applications is witnessing significant growth due to the increasing adoption of autonomous vehicles and the development of smart cities. Computer vision algorithms and deep learning techniques are driving innovation in this field, enabling autonomous machines to accurately detect and classify objects within intersection regions. However, challenges such as handling various environmental conditions and ensuring data privacy and security need to be addressed for the widespread adoption of these systems.

The Nvidia Corp invention works as follows
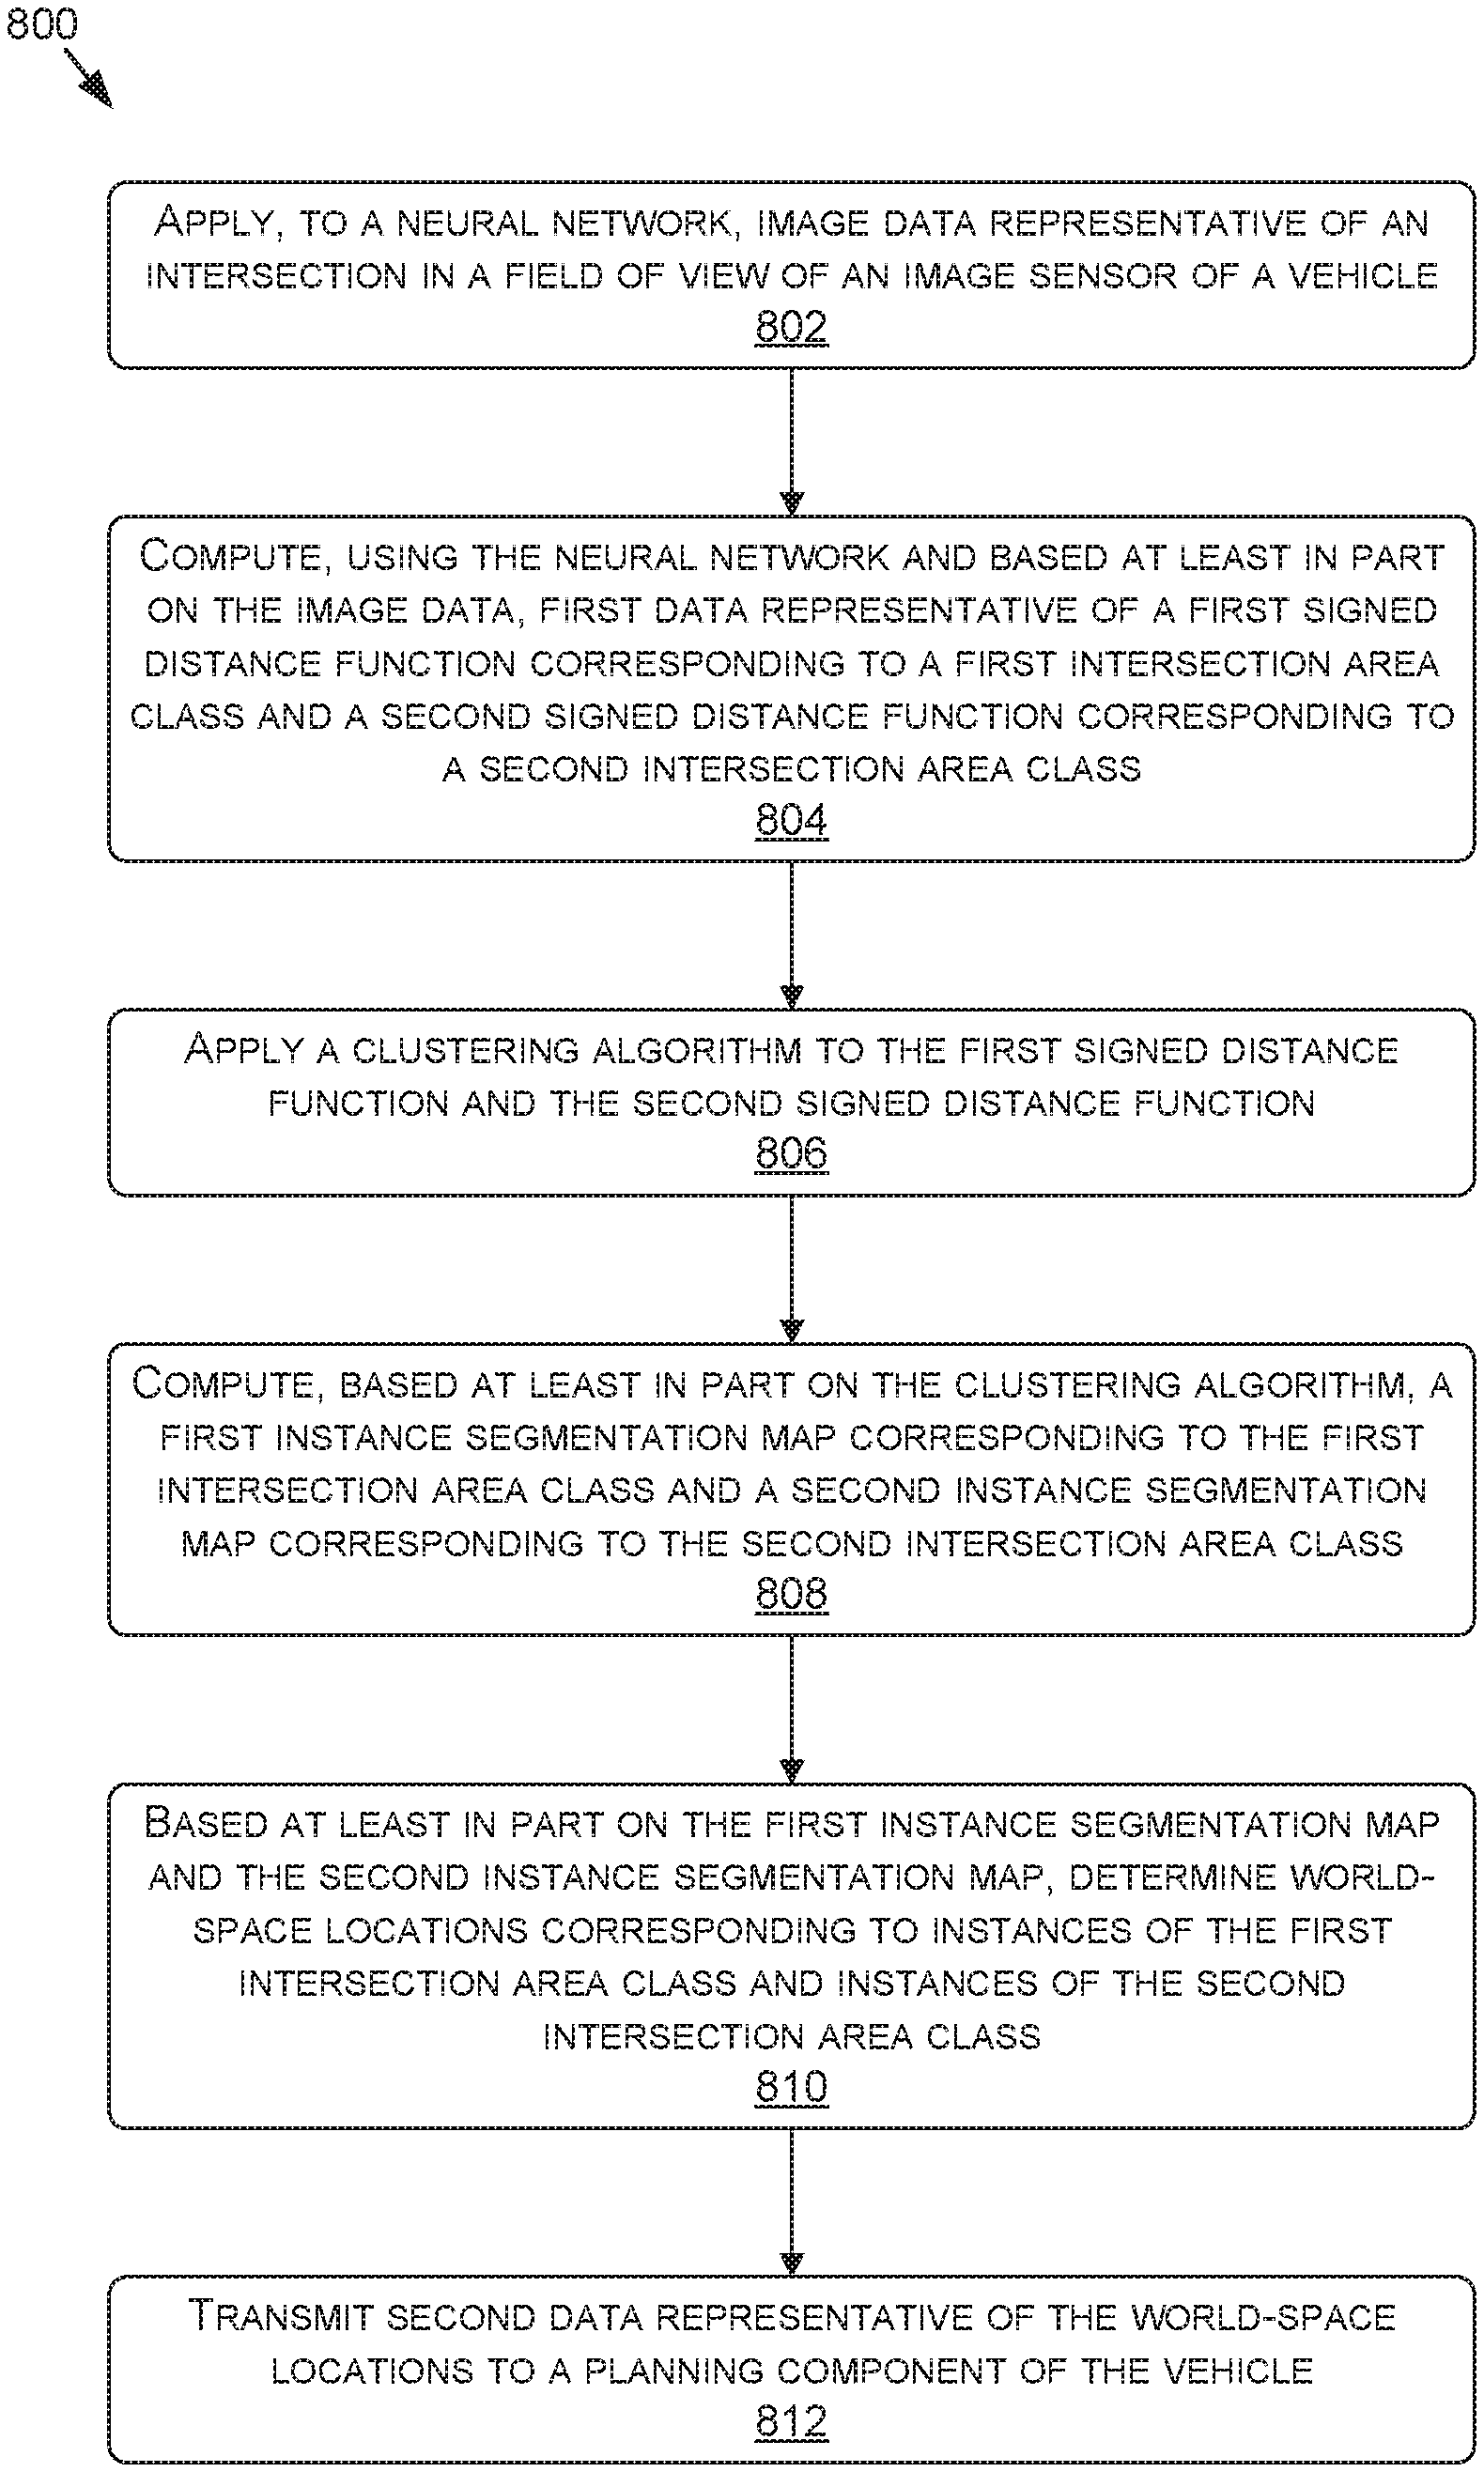
In various examples, the live perception of sensors on a car can be used to detect and classify conflict areas at intersections in an environment in real-time. A deep neural network (DNN), for example, may be trained to produce outputs such as signed distance functions that correspond to the locations of boundaries delineating area contention intersections. Signed distance functions can be decoded or post-processed in order to create instance segmentation masks that represent the locations and classifications for intersection areas and regions. The intersection areas or regions can be generated using image space and then converted into world-space coordinates. This will help an autonomous vehicle navigate intersections according the rules of the road or traffic priority considerations.
Background for Intersection Region Detection and Classification for Autonomous Machine Applications
Autonomous systems and advanced driver assist systems (ADAS), may use different sensors such as cameras and LIDAR/RADAR sensors to perform various tasks, including lane keeping, lane switching, lane assignment and camera calibration. They can also be used for path planning, localization, turning and path planning. In order for autonomous systems and ADAS to function independently and efficiently it may be necessary to generate an understanding of the environment surrounding the vehicle. This can be done in real-time, or even near-real-time. This may include information about the types and locations of objects and obstacles in the environment, as well as the lanes and/or intersecting points, with regard to different demarcations such as road boundaries, intersections and the like. A vehicle may use the information about the environment to make decisions such as what path to take, when to stop, or where to stop.
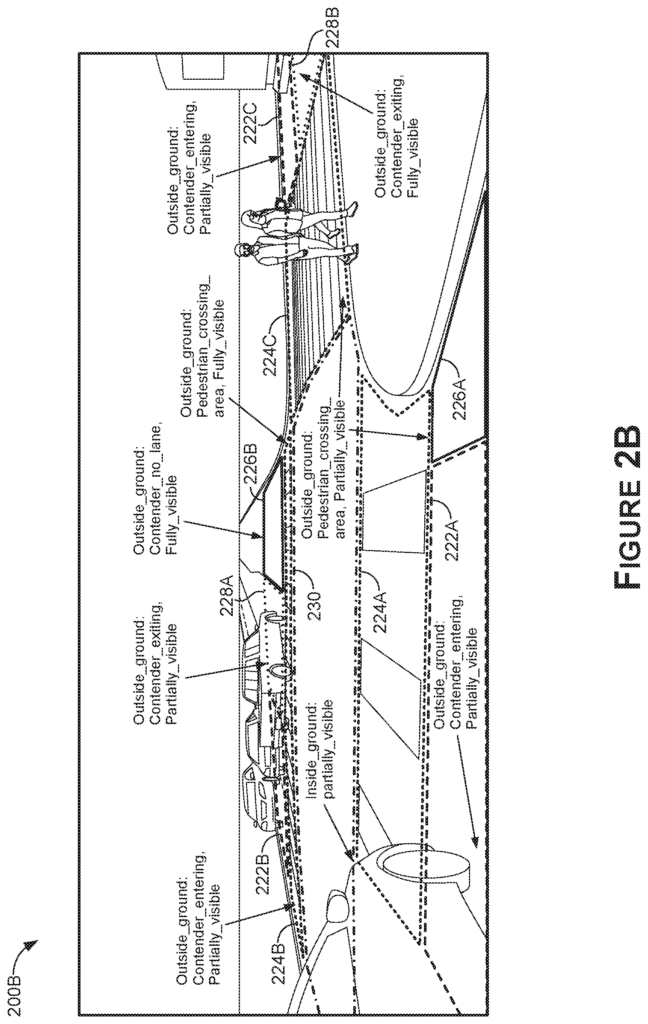
In an autonomous vehicle or semi-autonomous environment, for example, information about the layout, attributes and locations of intersections, such as where pedestrians or other vehicles may be, whether they have priority in crossing an intersection and/or similar, can prove useful when making decisions regarding path planning, obstacle avoidance and/or control. It is especially important for vehicles operating in urban or semi-urban environments where understanding intersections and planning paths is crucial because of the greater number of variables compared to highway driving. In a multi-lane bi-directional driving environment where vehicles must slow down and wait to cross an intersection, determining the locations and types of intersections (e.g. pedestrian crossings, vehicle entering or exiting, and no lane) is crucial. It is critical for safe and effective semi-autonomous and/or autonomous driving.
In conventional systems intersections can be interpreted using a combination of several features from an intersection as well as the surrounding environment. To detect an intersection, for example, multiple objects, such as traffic lights, stop signs, lanes and free-space boundaries can be detected separately, e.g. using a number of deep neural networks. These solutions, however, require detailed and accurate networks that can recognize and classify relevant features to detect intersections and combine them with a variety features to safely navigate the intersection while adhering to different traffic priority rules. The more complex intersections, the more detailed annotations will be required to train DNNs. This increases the difficulty of accurately detecting intersection areas and reduces the scalability. These conventional systems might not be able to provide a complete and accurate understanding of the vehicles or pedestrians that are traversing an intersection and may have priority in traversing it. Many conventional systems fail to detect intersections where sensor data is obstructed by buildings or other objects.
Other systems can analyze intersections by comparing features detected on the driving surface to those in high-definition (3D), pre-stored maps. Map-based solutions rely heavily on the accuracy and availability maps. These conventional systems are therefore ineffective when maps for certain areas are outdated or not available. The process becomes more complicated when the vehicle must navigate through different types of intersections. The conventional systems fail to work when there is a temporary intersection condition, such as a policeman directing traffic on the road or a school bus that has stopped.
Embodiments of this disclosure relate to the detection of intersection contention areas for autonomous machine applications.” The disclosures relate to systems and methods that utilize a deep neural networks (DNNs) to process sensor information from one or multiple sensors of a car in order to detect intersection regions?and the classifications associated therewith?to holistically create an understanding of intersections in real-time.
In contrast with conventional systems such as those described in the previous paragraph, the current system can use the live perception of a vehicle to detect, and then classify, intersection contention areas within a vehicle’s surrounding environment. A machine learning model (such as a DNN) may be trained to calculate outputs that correspond to an intersection, such as signed distance functions that correspond to intersection areas or regions and classes thereof. Then a post-processor can use this information in order to accurately and effectively determine the locations of intersection regions. Post-processing techniques include smoothing, clustering thresholding and upsampling. To determine 3D world space locations of detected intersection areas. The vehicle can use these world-space location and/or classifications to navigate safely and accurately through the intersection. The outputs of the DNN can be used either directly or indirectly, e.g. via decoding, to determine the locations and classifications of each intersection area.
The vehicle may then be able to autonomously travel more freely through cities, urban environments, and/or other locations without having to rely on HD maps?or in addition to relying on HD maps.” The vehicle will be able to autonomously travel more freely in cities, urban environments and/or other places without having to rely on HD maps.
Systems and Methods are disclosed for intersection contention area detection in autonomous machine applications. The present disclosure can be described in relation to an autonomous vehicle 900, (also referred to as “vehicle” 900 herein) or ‘ego-vehicle? The present disclosure may be described with respect to an example autonomous vehicle 900 (also referred to herein as?vehicle? oder?ego-vehicle?900), of which is described in FIGS. An example is given in FIGS. This is not meant to be restrictive. The systems and methods described in this document may, for example, be used with non-autonomous cars, semi-autonomous cars (e.g. one or more adaptive driving assistance systems (ADAS), robots (including warehouse vehicles), off-road vehicles (such as boats, helicopters and drones), motorcycles (including electric or motorized bikes), aircraft (including construction vehicles), underwater craft (such as submarines), and/or any other vehicle type. The present disclosure is also not limited to vehicle intersection structures. It can be applied in other areas such as augmented reality or virtual reality, robotics and security, autonomous or semiautonomous machine apps, or any other technology space where detection of environment structures or poses are used.
As described in this document, unlike conventional approaches to intersection contention area detection based on high-definition maps, current systems and techniques provide techniques for detecting and classifying intersection areas utilizing outputs from sensors. The vehicle’s perception can be captured in real-time, or even near-real-time. For each intersection, the live perception of the car may be used to detect the locations, attributes, or classifications for the intersection area corresponding to that intersection. The model(s) of computer vision and/or machine-learning (e.g. deep neural networks, such as convolutional networks) can be trained to produce outputs which, after decoding in embodiments, result in detected intersections, and/or attributes or classifications thereof. These outputs may then be used by the vehicles in conjunction with object detections and/or lane recognitions in order to navigate intersections accurately and effectively while adhering to traffic priority rules. In some embodiments, the output from the computer vision or machine learning model(s), may include signed distance functions, which represent the pixel-based location of specific regions of the image in which the classified intersection areas are detectable. Post-processing can be applied to the signed distance functions in certain embodiments to create instance segmentation masks for each detected intersection type and/or area.
The system can learn to diagnose an intersection in real-time, or close to real-time, as it uses live perception. It is also not necessary to have prior experience or knowledge of an intersection.
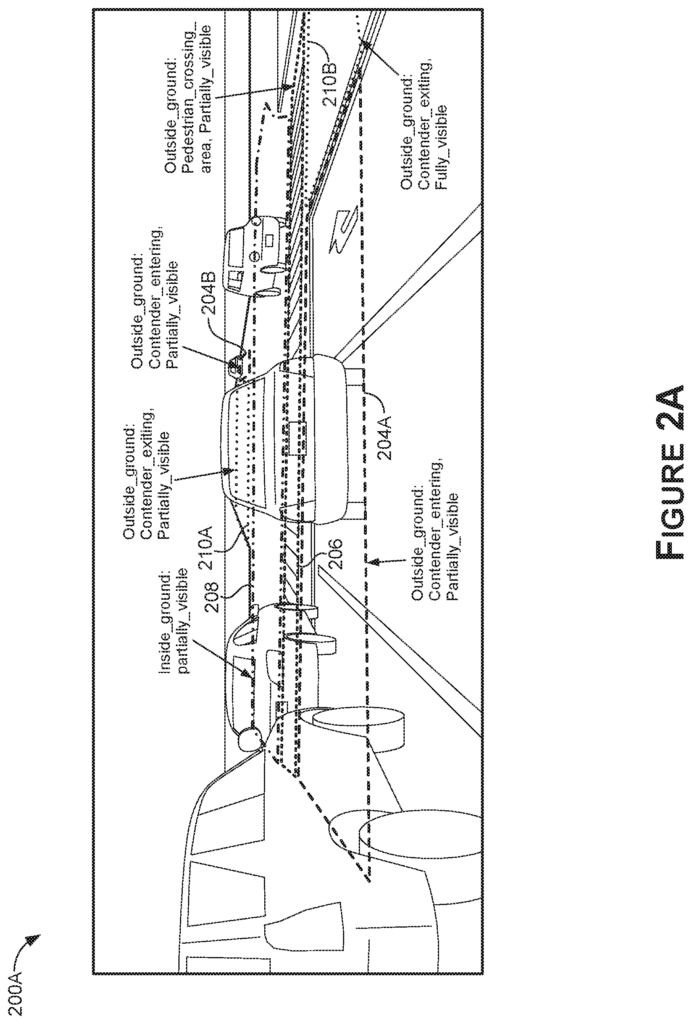
Sensor data can be received and/or generated using sensors (e.g. cameras, RADAR sensors, LIDAR sensors, etc.). Sensors (e.g. cameras, radar sensors, LIDAR sensor, etc.) may be used to receive and/or generate data. The sensors may be located on or installed in an autonomous vehicle or semi-autonomous car. The sensor data can be used to train a DNN to identify intersections of interest (e.g. intersection interior, entry to an intersection, exit from an intersection, no lane or pedestrian crossing, unclear areas, etc.). Sensor data and semantic information are represented by sensor data. The DNN(s), in particular, may be trained to calculate signed distance functions for each intersection area instance detected. Signed distance functions can be computed for each pixel in the sensor data. They may include a (pixel-) distance to the closest boundary of the intersection, a location (e.g. negative for pixels outside an intersection area and positive for pixels within the intersection), semantic information (e.g. pedestrian crossing, intersection entrance, intersection exit or unclear area), intersection interior (or a combination), or other information. In some examples the computed intersections in the signed distance function may be represented by pixels or points that are part of the sensor data. Pixels on the boundary of the intersection area can be represented as a value zero. The pixels within the boundaries of the intersection are denoted with a positive value which corresponds to a proximity to the nearest boundary of the region. And the pixels outside of the boundaries of the intersection are denoted with a negative distance value, which corresponds to a proximity to the nearest boundary of the region In some examples, each intersection area class may be represented by a different signed distance functions (e.g. one signed distance for each class or a signed distance for each instance). The signed distance functions, along with the information they contain, can be used to determine the location and class of intersection areas. The intersection area classes can include, without limitation, pedestrian crossings, intersection entries, exits, areas with unclear boundaries, no lanes, interior intersections, or other information related to the intersection.
The DNNs can be trained to predict different types of information, e.g. via any number channels that correspond to intersection area classifications. One or more channels could represent the signed distance functions of a class of an intersection area and/or each instance of it. During training, DNNs may be trained using images or other representations of sensor data labeled with polygons that represent pedestrian crossing areas. In addition to the boundary label or annotation, the ground truth annotations may include semantic information?e.g., classifications?corresponding to each of the boundaries. A ground truth encoder can use the labeled polygons, along with the semantic information, to produce signed distance functions. Each function corresponds to an intersection type that is determined by the annotations. In some examples, a signed distance functions may encode each pixel with a value that corresponds to the distance between the pixel and the closest boundary of an intersection area (e.g. along the bounding shape annotated in the training data). In these examples, pixels within the intersection areas may also be encoded as positive distance values and pixels outside of the intersection areas may be encoded as negative distance values or vice versa. For ground truth data, the pixels that form the boundaries of intersection areas may be encoded as zero values.
In some cases, instead of or in addition to using signed distance functions the labeled polygons, and semantic information, may be used by ground truth encoders to generate one-hot encode maps for each type of intersection area, where pixels within an intersection area border are encoded as 1, and pixels outside of the intersection area boundaries are encoded as 0. When using one-hot encode, adjacent regions (e.g. The shared boundaries may not be identifiable separately and may result in a reduction of accuracy compared to embodiments that use signed distance functions. The intersection areas can be encoded with signed distance functions or one-hot encoding, and minimal labeling is required.
The DNNs may then regress the outputs of the signed distance functions, one hot encoding maps and/or any other outputs that correspond to the encoded channels for which the network has been trained to predict. This is described in this document. The pixel distances for different classification types and/or instances of them may be converted into 2D coordinates (e.g. each pixel in the area, boundary pixels, vertices, etc.) when the output corresponds with signed distance functions. In some embodiments the signed distance functions can be smoothed using Gaussian methods pixel by pixel to remove sharp peaks or fluctuations. Smoothed signed-distance functions can then be mapped onto polygons representing intersection areas, based on negative and positive values of each pixel. In some embodiments, an instance segmentation algorithm based on a watershed-clustering algorithm can be used to create a map for each detected intersection region or area. In these embodiments, pixels with too high or too low distance values may be filtered using a threshold distance value, reducing compute resources. The pixels remaining may be used for determining the boundaries of intersection areas and/or determining each pixel associated with a region of an intersection that has a classification type associated. The pixel values for each pixel in the boundaries of the polygon defining the intersection area can then be encoded to show a segmentation. The output of the post-processing may be instance segmentation masks for each classification type?or instance thereof?corresponding to locations of different classification type regions of the intersection.
In some embodiments, 2D image space locations can be used to determine 3D world-space coordinates at intersections to help the vehicle navigate through the world-space. Sensor intrinsic and/or external parameters can be used to map a 2D image space location to a known 3D world space location. However, in some embodiments the DNNs may be trained using 3D data for predicting locations in 3D space.
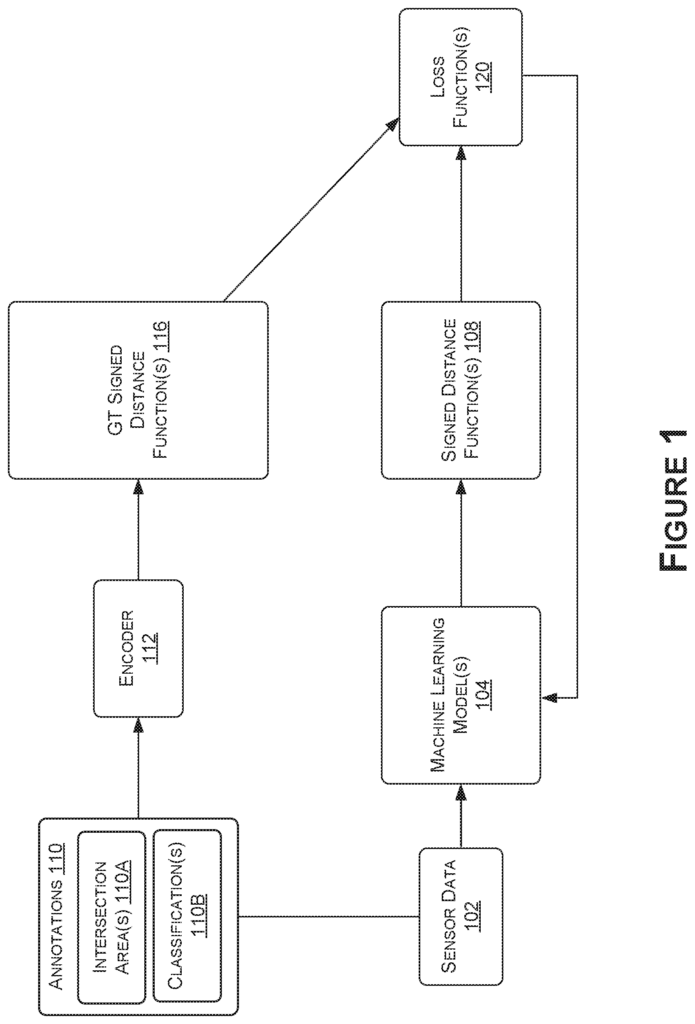
Referring to Figure 1, FIG. 1, FIG. According to some embodiments, FIG. 1 illustrates an example data flow chart 100 of a process for training a neuronal network to detect areas or regions at intersections to assist a vehicle to navigate intersections. This and other arrangements are described only as examples. The process 100 can be described as a system that includes one or multiple machine learning models 104, which receive one or several inputs such as sensor data, and generate one or many outputs such as signed distance functions 108. Sensor data 102 can be called training data in some cases when it is used to train. The sensor data 102, although primarily described in relation to image data representing images, is not meant to be limiting. Other types of sensor information used for intersection area identification, such as LIDAR, SONAR, RADAR, or the like, may also be included. 9A-9D).
The process 100 can include receiving and/or generating sensor data 102. As an example and without limitation, the sensor data 102 can be received from one or multiple sensors of a car (e.g. vehicle 900 in FIGS. The sensor data 102 may be received, as an example that is not limited to any particular vehicle (e.g., the vehicle 900 of FIGS. The vehicle and the process 100 may use the sensor data 102 to detect intersections to navigate intersections real-time or in near-real-time. Sensor data 102 can include without limitation sensor data from any sensor of the vehicle, including those shown in FIGS. 9A-9C, global navigation satellite systems (GNSS) sensor(s) 958 (e.g., Global Positioning System sensor(s)), RADAR sensor(s) 960, ultrasonic sensor(s) 962, LIDAR sensor(s) 964, inertial measurement unit (IMU) sensor(s) 966 (e.g., accelerometer(s), gyroscope(s), magnetic compass(es), magnetometer(s), etc. The sensor data 102 may also include virtual (e.g. simulated or augmented) sensor data generated from any number of sensors in a virtual (e.g. testing) environment. Sensor data 102 can also include virtual sensor data (e.g. simulated or enhanced) generated by any number of sensors on a virtual vehicle, or another virtual object, in a simulated (e.g. testing) environment. In this example, virtual sensors can correspond to a vehicle or another virtual object within a simulated (e.g. used for testing neural network performance, training and/or validation), and virtual sensor data can represent sensor data captured from the virtual sensors in the simulated or augmented environment. By using virtual sensor data, machine learning models 104 described in the present invention may be trained, tested and/or verified using simulated data or augmented data within a simulated environment. This may allow testing of more extreme scenarios away from a real-world setting where such tests are less safe.
In some embodiments, sensor data 102 can include image data that represents an image (or images), image data that represents a video (e.g. snapshots of videos), and/or sensor information representing representations for sensory fields (e.g. depth maps for LIDAR, a value chart for ultrasonic sensors). Where the sensor data 102 includes image data, any type of image data format may be used, such as, for example and without limitation, compressed images such as in Joint Photographic Experts Group (JPEG) or Luminance/Chrominance (YUV) formats, compressed images as frames stemming from a compressed video format such as H.264/Advanced Video Coding (AVC) or H.265/High Efficiency Video Coding (HEVC), raw images such as originating from Red Clear Blue (RCCB), Red Clear (RCCC), or other type of imaging sensor, and/or other formats. In some cases, sensor data may be used in the process 100 in its raw format (e.g.), while in others, it may undergo preprocessing. The sensor data 102 can refer to unprocessed data, preprocessed data, or even a combination of both.
The sensor data 102 that is used to train the model(s) 104 can include original images captured by image sensors, down-sampled or up-sampled versions of those images, images cropped, images with a region of interest (ROI), or otherwise enhanced images. The machine learning models 104 can be trained with the images and/or sensor data 102, as well as ground truth data. The ground truth data can include annotations such as labels, masks and maps. In some embodiments, ground truth data can include signed distance functions 116. The annotations 110 may be used by an encoder 112 to encode the GT-signed distance function(s). The annotations 110 can include intersection area(s), 110A, and classification(s), 110B.
In some examples, “With regard to the annotations, the annotations may be generated in a drawing program” (e.g. an annotation program), within a computer-aided design (CAD), or labeling program. They may also be drawn by hand. The annotations 110 or the GT signed distance functions 116 can be produced in a variety of ways. They may be synthesized (e.g. generated from computer models), real produced, machine-automated, (e.g. using feature analysis and machine learning to extract data features and then produce labels), or human-annotated.
The intersection area(s), 110A, may include annotations or other label types corresponding to bounding forms?e.g. polygons?delineating intersection areas of interest. In some cases, a sensor data representation of the sensor 102 may delineate an intersection area by one or more polygons that correspond to pedestrian crossings, intersection entry and exit areas. These polygons can be generated using bounding boxes. The classification(s), 110B, may be generated separately for each image (or other representation of data) and/or each polygon in the images that are represented by the sensor data(s), 102 which is used to train the machine learning models, 104. The number of classifications 110B can be correlated to the types and/or number of features that machine learning models 104 are trained to predict or the number of intersections and/or features in each image.
Click here to view the patent on Google Patents.
Leave a Reply