
Invented by Hugh L. Brunk, Geoffrey B. Rhoads, Cynthia Archer, Arlie Conner, Digimarc Corp
Sensor-synchronized spectrally-structured-light imaging involves the use of a sensor that captures both spatial and spectral information simultaneously. This is achieved by illuminating the scene with a patterned light source and using a spectrometer to measure the spectral response of the reflected light. By synchronizing the sensor with the light source, precise measurements can be obtained, allowing for detailed analysis and reconstruction of the scene.
One of the key advantages of this imaging technique is its ability to capture both spatial and spectral information in a single measurement. Traditional structured-light imaging techniques only provide spatial information, while spectral imaging techniques capture spectral information but lack spatial resolution. Sensor-synchronized spectrally-structured-light imaging overcomes these limitations, enabling researchers and professionals to obtain comprehensive data in a single scan.
The applications of sensor-synchronized spectrally-structured-light imaging are vast and diverse. In the field of medicine, this technology can be used for non-invasive diagnostics, such as skin cancer detection or monitoring blood oxygen levels. By analyzing the spectral response of the skin or blood vessels, healthcare professionals can identify abnormalities or changes that may indicate a health condition.
In the manufacturing industry, sensor-synchronized spectrally-structured-light imaging can be utilized for quality control and inspection purposes. By analyzing the spectral response of a product’s surface, manufacturers can detect defects or inconsistencies that may affect its performance or appearance. This technology can also be used for 3D scanning and modeling, allowing for accurate measurements and analysis of complex objects.
Furthermore, sensor-synchronized spectrally-structured-light imaging has applications in agriculture, environmental monitoring, and cultural heritage preservation. In agriculture, this technology can be used to assess crop health, detect diseases, and optimize irrigation. Environmental monitoring can benefit from this imaging technique by analyzing the spectral response of water bodies, vegetation, or air pollutants. In cultural heritage preservation, sensor-synchronized spectrally-structured-light imaging can aid in the documentation and restoration of artifacts, paintings, or historical sites.
As the demand for high-quality imaging solutions continues to grow across various industries, the market for sensor-synchronized spectrally-structured-light imaging is expected to expand significantly. Advancements in sensor technology, spectral analysis algorithms, and data processing capabilities will further enhance the performance and versatility of this imaging technique.
In conclusion, sensor-synchronized spectrally-structured-light imaging is a promising technology that combines the benefits of structured-light imaging and spectral imaging. Its ability to capture both spatial and spectral information in a single measurement makes it a valuable tool in various industries, including medicine, manufacturing, agriculture, and environmental monitoring. As technology continues to advance, the market for this imaging technique is expected to grow, providing professionals with advanced imaging solutions for a wide range of applications.
The Digimarc Corp invention works as follows
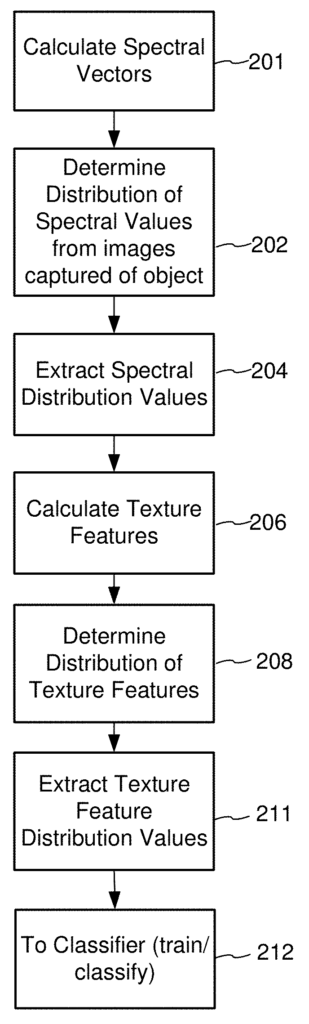
The pulsing LED light sources are synchronized to the capture of each image frame by the sensor. One implementation uses the CIE color matching function and/or orthogonally transform functions to enable direct capture of chromaticity. These configurations and others of spectral-capture devices are used to capture spectral pictures that contain spectral vectors with multiple dimensions per pixel. These spectral pictures are used for object classification, identification, and other applications. Identifying produce (such as fruit or vegetables) is one of the most common applications. “A wide range of other features and arrangement are also detailed.
Background for Sensor-synchronized spectrally-structured-light imaging
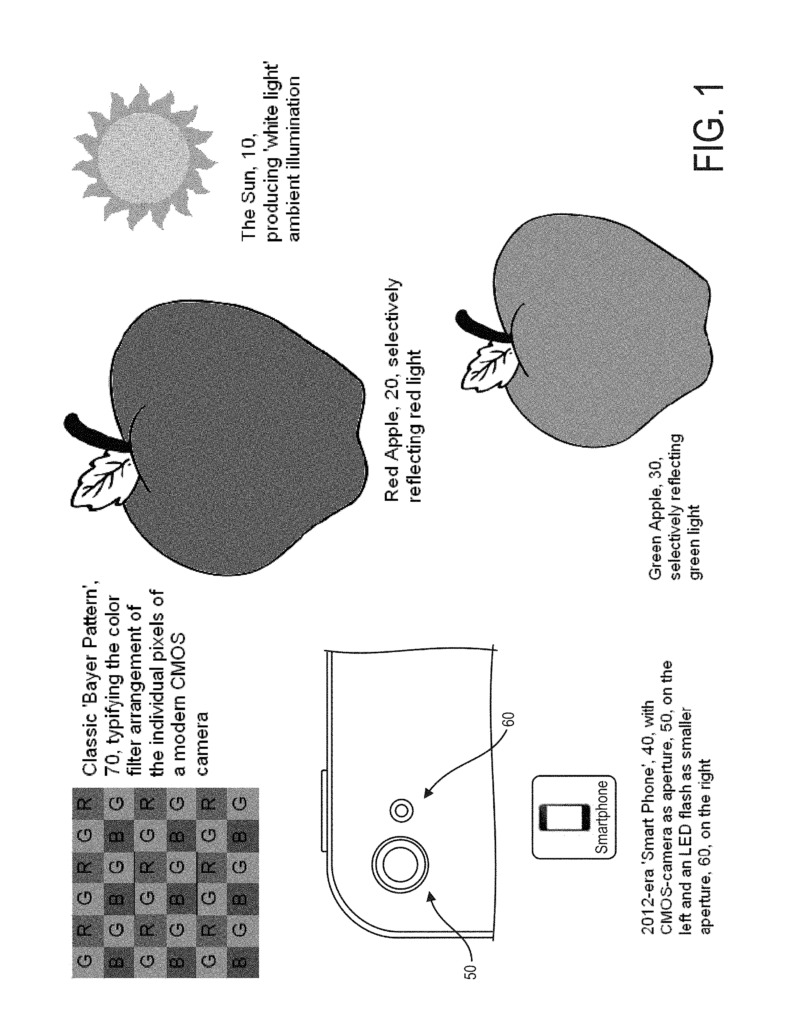
Both natural light (?ambient?) Flash-assisted photography (read in broader terms: “human assisted light supplementation?) Since the Daguerreotype, photography has been around. This disclosure focuses on the technology behind a particular form of lighting called “flash”. The technology of this disclosure concerns how primarily the latter form of lighting, which we will call “flash” for simplicity’s sake, can be designed and implemented in such a way as to effectively qualify them within the general art referred to as “imaging spectrometry?” or “hyper-spectral imaging? “Or ‘hyperspectral imaging.’
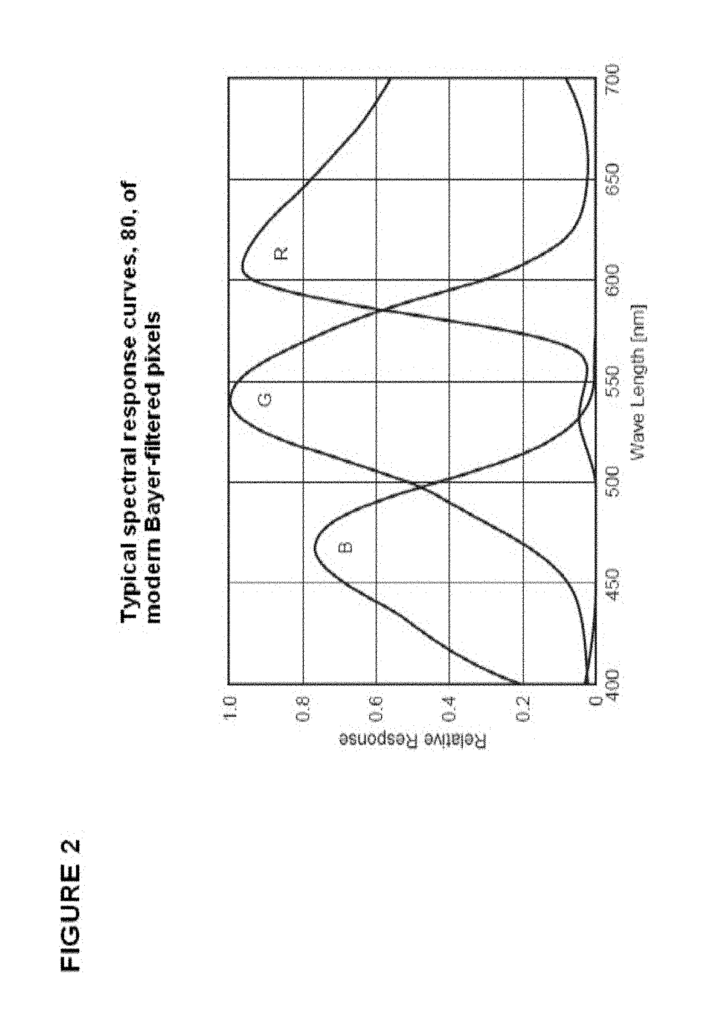
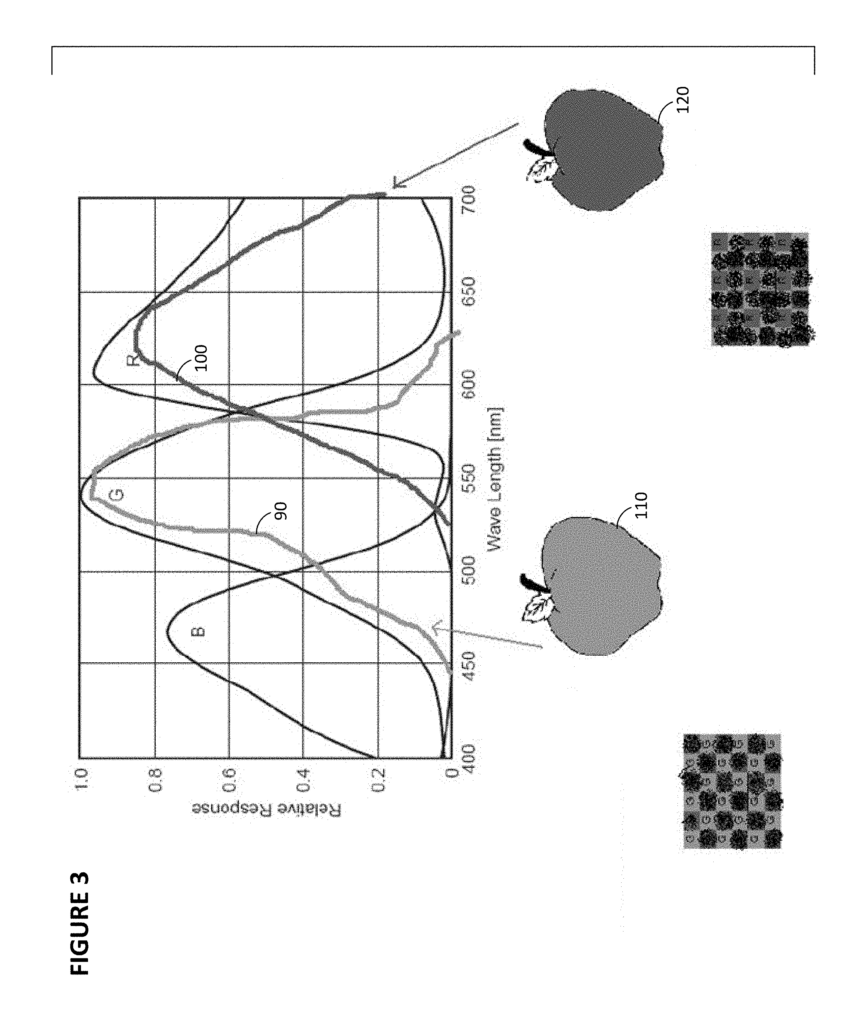
In essence, by illuminating the scene with a series of brief (frame-synchronized),?spectrally? Even a Bayer pattern CMOS can be used to create an imaging spectrometer that has ‘N bands. N is currently around 5-10 bands but this will likely increase as the technology advances.
An introduction to the technology must note multi-chip leds (see, e.g. The Federal FM series from Edison’s 2012 era is shown in FIG. 7 as at least a “seed” for creating “spectrally structured lights. In several embodiments, synchronizing the pulsing from different LED light sources to individual frames on a CMOS camera creates informational base for N-band image. Other light sources can be considered, but 2012 standards require multi-chip or dual? LEDs are the leading candidates for this technology.
The 3 very well-known CIE color matching functions from 1931 and/or their orthogonally transformed functions are a particularly interesting choice of “bands”. The 3 well-known CIE color matching functions from 1931 and/or their orthogonally shifted functions are the most intriguing choice of “bands”. This opens the door to a multiverse future for color photography: “direct chromaticity” capture. This disclosure
This disclosure includes a description of the principles of design and physical implementations for converting virtually any electronic image sensor into an imaging spectrum analyzer by coordinating it with supplementary light sources. The core ‘how? The core?how? Then, applications are presented and described. These include A) the niche application of hyper-spectral imaging, B) the medical imaging potential of this technology, C) radically improved color photography for both?digital cameras?
This disclosure has been significantly expanded in many areas since the initial disclosure.
Below are described many more configurations of system, lighting, sensing, pixel post-processing techniques, and devices. The disclosure is not limited to any particular embodiment, but contemplates a wide range of inventive combinations. As examples, we provide source code. The signal processing described can be implemented in software instructions that are executed on special-purpose processors or general-purpose computing devices, such as devices with DSPs and GPUs. These software instructions can be ported to processor device-specific firmware versions, ASICs or FPGAs. Cloud computing services can be used to execute the software in various combinations and for different purposes (such as training, classification, and recognition).
The following Detailed Description will make it easier to understand the foregoing, as well as other features and benefits of the current technology. It is based on the drawings that accompany the Detailed description.
Classifiers of Produce
Researchers have been experimenting with digital color cameras (Red Green and Blue) to classify fruit or vegetables. IBM made one in the late 90s. See, Bolle, Connell, Hass, Mohan, Taubin. ‘VeggieVision: a Produce Recognition System’,?Proceedings of Third IEEE Workshop on Applications of Computer Vision?, pp. 224-251, 1996. The researchers classified 48 different produce products. The researchers used a combination color and texture features. Color features were three concatenated histograms of the produce item, computed in the Hue-Saturation-Intensity (HSI) space. They tried several different gradient measurements for texture. The texture features are histograms that show the gradient overlaid on the image. Both gradient measures were similar. They used the nearest neighbor classifier. The correct classification was 90% of time one of the four top predicted classes for color (with hue as the most important), 63% for texture, and 97% for both color and texture. This result shows that a simple fast classifier can separate categories well with just a single feature vector.
Several recent publications from university researchers offer guidance on possible color and texture characteristics for grouping produce in categories. A group from Brazil, working with Cornell, studied a number of different features and classification types on a collection of 15 different produce products. See, Rocha, Hauagge, Wainer, Goldenstein. “Automatic Fruit and Vegetable Classification from Images”, Computers and Electronics in Agriculture 70, 96 – 104, 2010. Images were taken of one or more items against a white uniform background. Images were captured using a digital RGB camera. The color and texture descriptors include:
2. Our Features. Our features is a texture measurement that works on the intensity channel. The sum and difference between two pixels is calculated at a specific scale. The sum and difference images are then histogrammed.
3. Color Coherence vectors. Color coherence Vectors are often used in image search queries of the type “find other pictures similar to this one”. They are similar to the color histogram when it comes to classification power.
4. Border/Interior Color Histogram. This method uses two histograms of color, one for pixels in the interior and one for those on the edge of the region. This metric captures color and texture information and is the best feature explored in this research.
5. Appearance descriptors. This feature matches small areas of the intensity image with a set (edge/texture descriptors) that is similar to the Haar features for face detection. This feature set was not very effective and its evaluation in the paper was omitted.
The researchers examined a number classifier methods, and one-versus-one support vector machines (SVM) was the clear winner. The Border/Interior Color Histograms were used to classify the images. They were successful 95.8% of time. Using a combination features, they could bring the top two classifications up to 97%.
An Indian group of researchers used the same data to perform a different set experiments with less success. See, Arivazhagan, Shebiah, Nidhyanandhan, Ganesan. Fruit Recognition Using Color and Texture Features, Journal of Emerging Trends in Computing and Information Sciences 90-94, 2010, The authors used a cooccurrence histogram to measure texture. Instead of using the histogram, they calculated several statistics including contrast, local homogeneity and energy and used these statistics to create features. They also computed histograms for hue and saturation to measure color and then derived statistics. The final feature vector contained 13 statistical features. Color statistics were particularly poor, only achieving 45% accuracy in classification. The texture feature performed better, with an average classification of 70%. Combining features gave the best results, with 86% of correct classification. This study shows that color histograms can capture important characteristics of produce, but reducing them to statistics has less effectiveness.
Most recently a group from China conducted an independent study that was similar to the one performed by Rocha et. al. On a set consisting of 18 fruits only (no vegetables). See Zhang and Wu. Sensors, p. 12489-12505, 2012. The SVMs were a combination color, texture and shape features. The color feature is a color histogram. The statistical measures used were mean, contrast, homogeneity and energy. The researchers also measured eight shapes including the area, perimeter and convex area of a fitted oval, as well as its minor and major axis. Unfortunately, the researchers did not analyze the relative importance of each type of feature (color, shape, texture), making it difficult to determine the effectiveness of these features. It would have helped to know which shape features, if any provided discriminability. The researchers performed PCA to reduce the dimension of the feature set from 79 down to 14. Researchers tested classifiers using a one-versus All and a one-versus one approach. The one-versus one method was the clear winner. The researchers’ classifiers were 53.5% correct when using a linear RBF SVM, and 88.2% accurate using a SVM based on radial basis functions (RBF). PCA may have contributed to the poor performance of linear classifier. “The reduction of the Unser characteristics to statistics could have had a negative impact on classification accuracy.
A quick clarification of what constitutes a classification performance minimum. With two classes that are equal in size, you can achieve 50% accuracy by “flipping a penny” To select the class. When there are more classes than two, the misclassification threshold is no longer 50%. “For three classes, the floor is 33%; for four classes, 25%; for twenty classes, 5%.
FIG. “FIG.
Click here to view the patent on Google Patents.
Leave a Reply