Invented by Huang Xia, Sanket Patel, SymphonyAI Sensa LLC
Spreadsheets have long been the go-to tool for data analysis due to their user-friendly interface and versatility. They allow users to organize, manipulate, and visualize data in a tabular format. With the addition of TDA capabilities, spreadsheets can now offer even more advanced analysis techniques.
One of the key advantages of using spreadsheets for TDA is the ease of use. Spreadsheets are widely used across industries, and most professionals are already familiar with their basic functionalities. By incorporating TDA into spreadsheets, users can leverage their existing skills and seamlessly integrate topological analysis into their workflow.
Another benefit of using spreadsheets for TDA is the ability to handle large datasets. Spreadsheets are designed to handle large amounts of data, and with the advancements in computing power, they can now handle complex topological calculations. This allows users to analyze datasets of any size and complexity, without the need for specialized hardware or software.
Furthermore, spreadsheets offer a visual representation of data, which is crucial for understanding and interpreting complex topological structures. TDA often involves the visualization of high-dimensional data in lower-dimensional spaces, such as graphs or networks. Spreadsheets provide a familiar and intuitive interface for creating and manipulating visualizations, making it easier for users to explore and analyze their data.
The market for topological data analysis using spreadsheets is still relatively new, but it is rapidly growing. Several software companies have recognized the potential of incorporating TDA into spreadsheet software and have started developing plugins or add-ons to enable this functionality. These tools aim to bridge the gap between TDA and spreadsheet analysis, making it accessible to a wider audience.
Additionally, the demand for TDA in various industries is increasing. From finance to healthcare to marketing, organizations are recognizing the value of extracting insights from complex datasets. By integrating TDA into spreadsheets, these industries can leverage their existing data analysis infrastructure and empower their employees to perform advanced topological analysis.
However, there are some challenges that need to be addressed in order to fully realize the market potential of TDA using spreadsheets. One of the main challenges is the need for user-friendly interfaces and intuitive workflows. TDA can be a complex and technical field, and it is important to develop tools that make it accessible to users with varying levels of expertise.
Furthermore, ensuring the accuracy and reliability of TDA algorithms within spreadsheet software is crucial. Topological analysis involves complex mathematical calculations, and any inaccuracies or errors can lead to misleading results. Software developers need to invest in rigorous testing and validation processes to ensure the accuracy of their TDA implementations.
In conclusion, the market for topological data analysis using spreadsheets is a promising and rapidly growing field. By incorporating TDA capabilities into spreadsheet software, users can leverage their existing skills and infrastructure to perform advanced topological analysis. With the increasing demand for TDA in various industries, the market potential for TDA using spreadsheets is only expected to grow further.
The SymphonyAI Sensa LLC invention works as follows
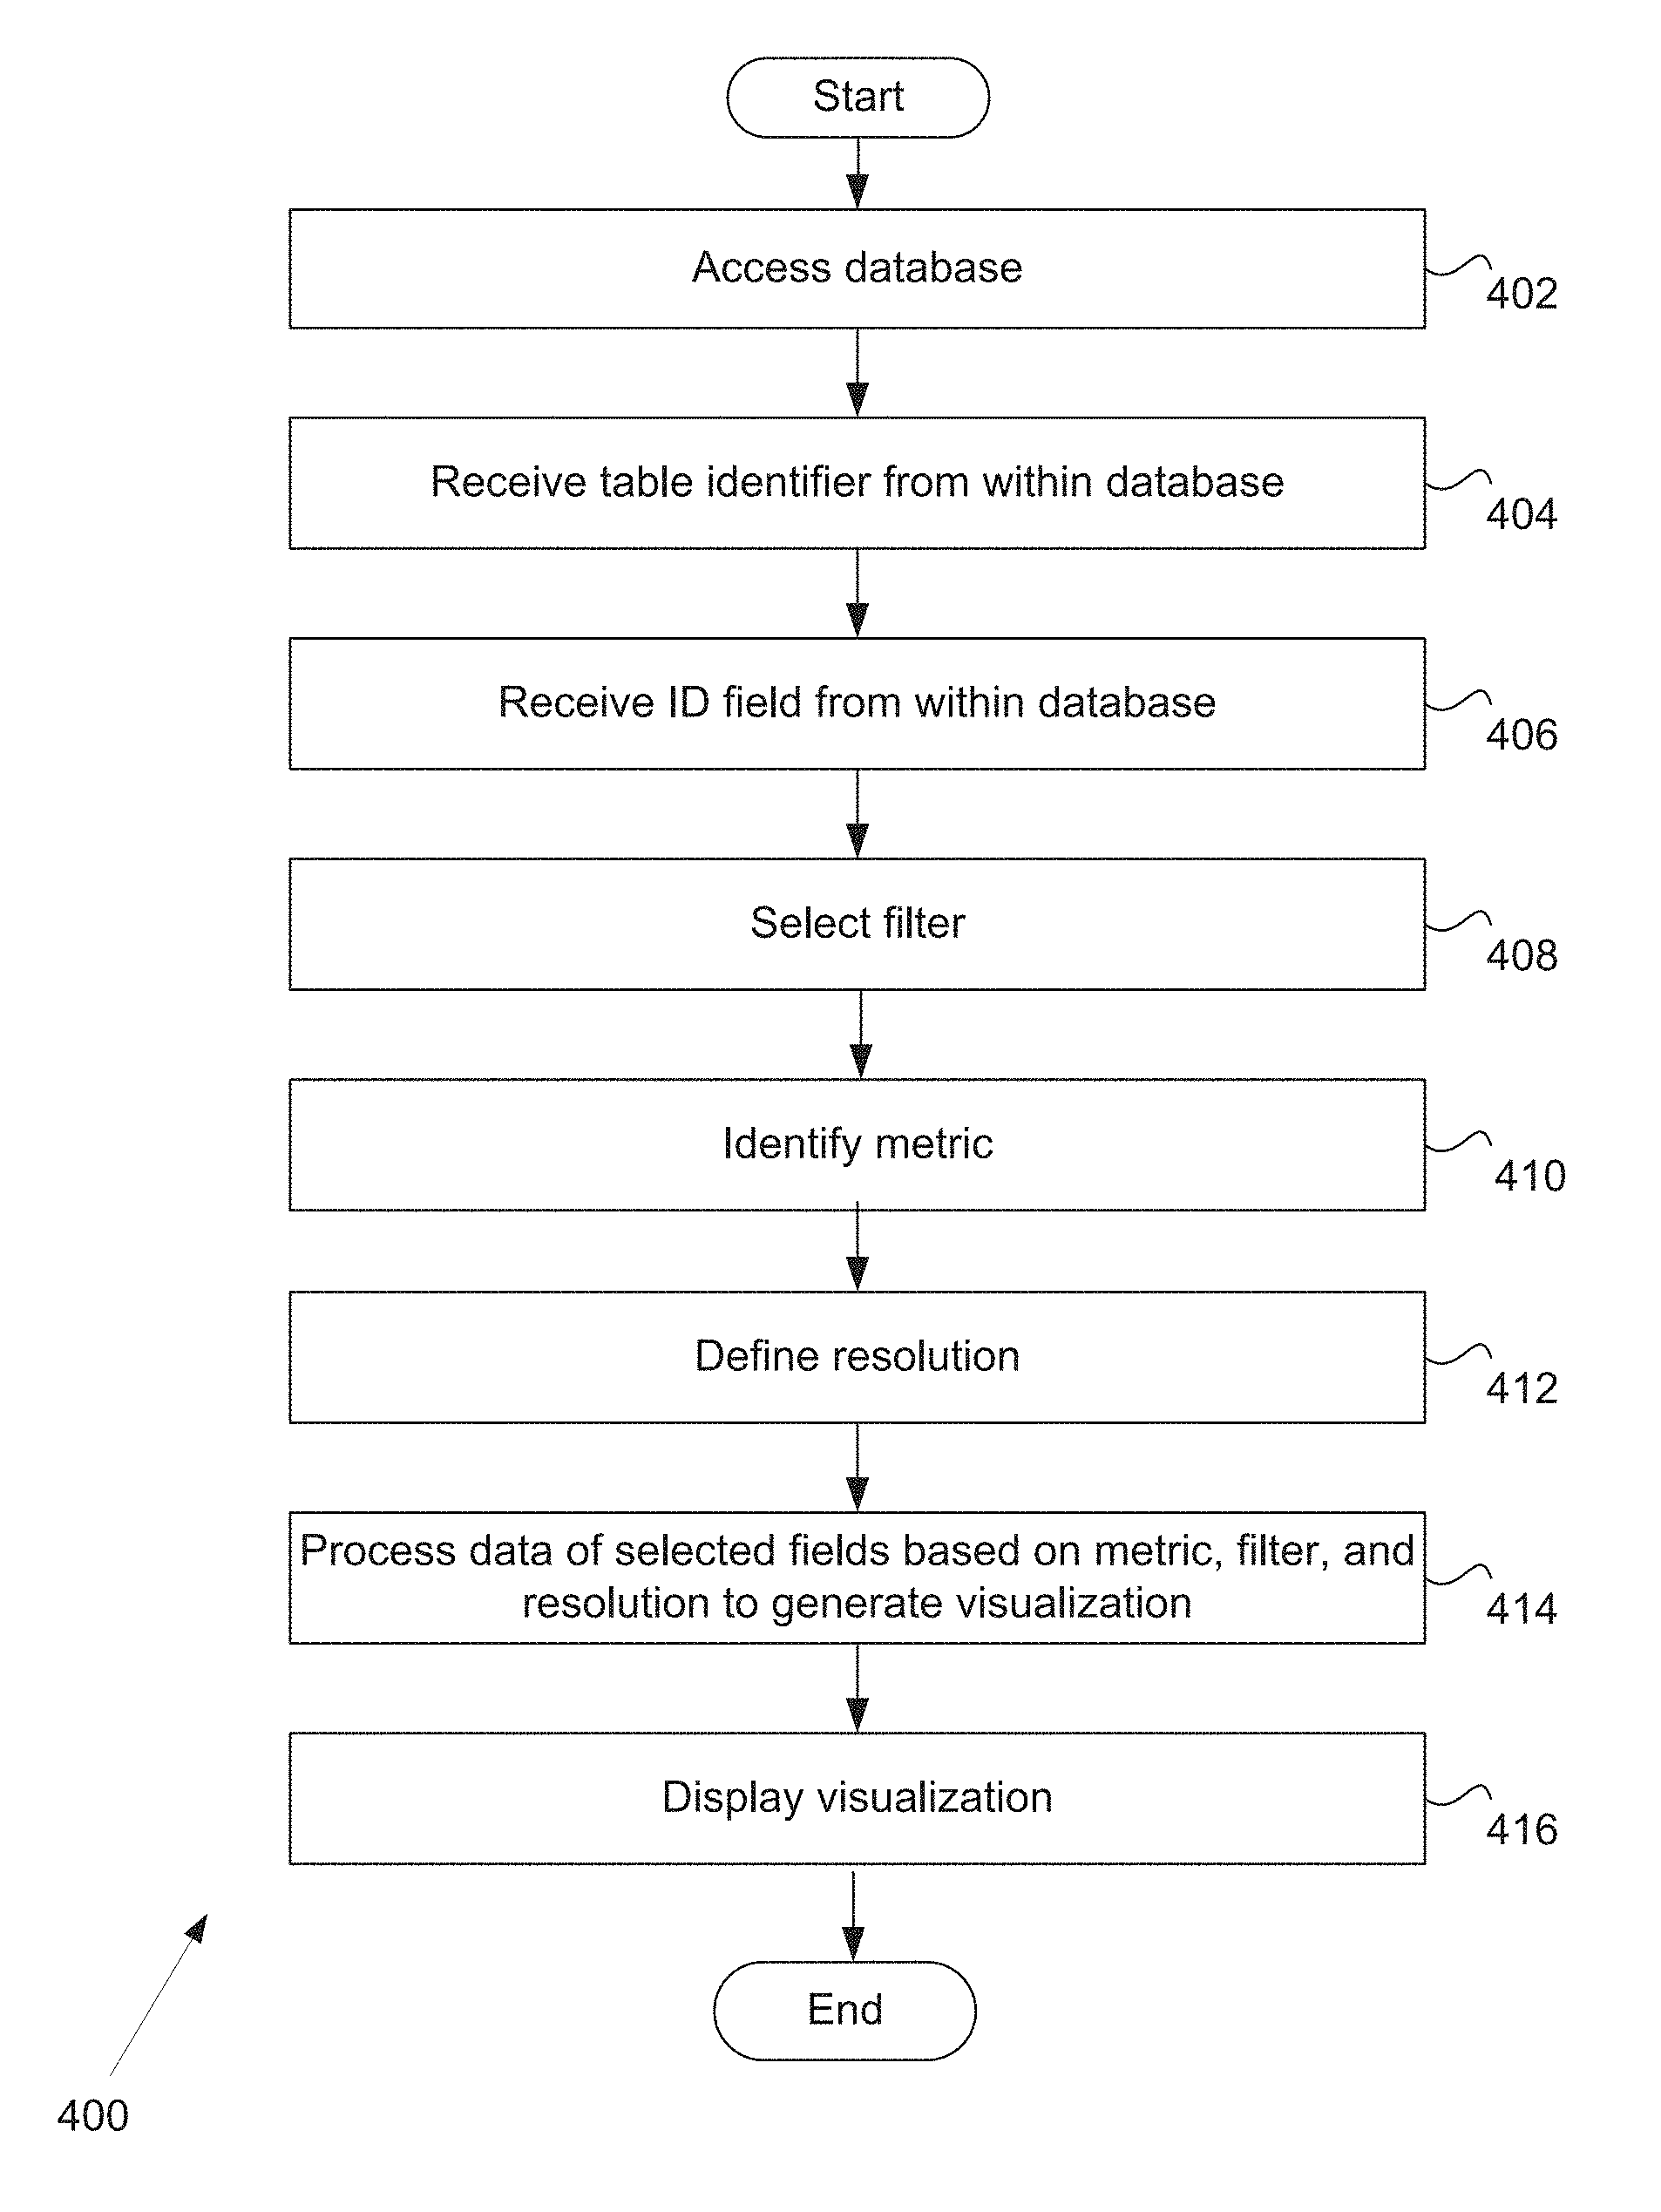
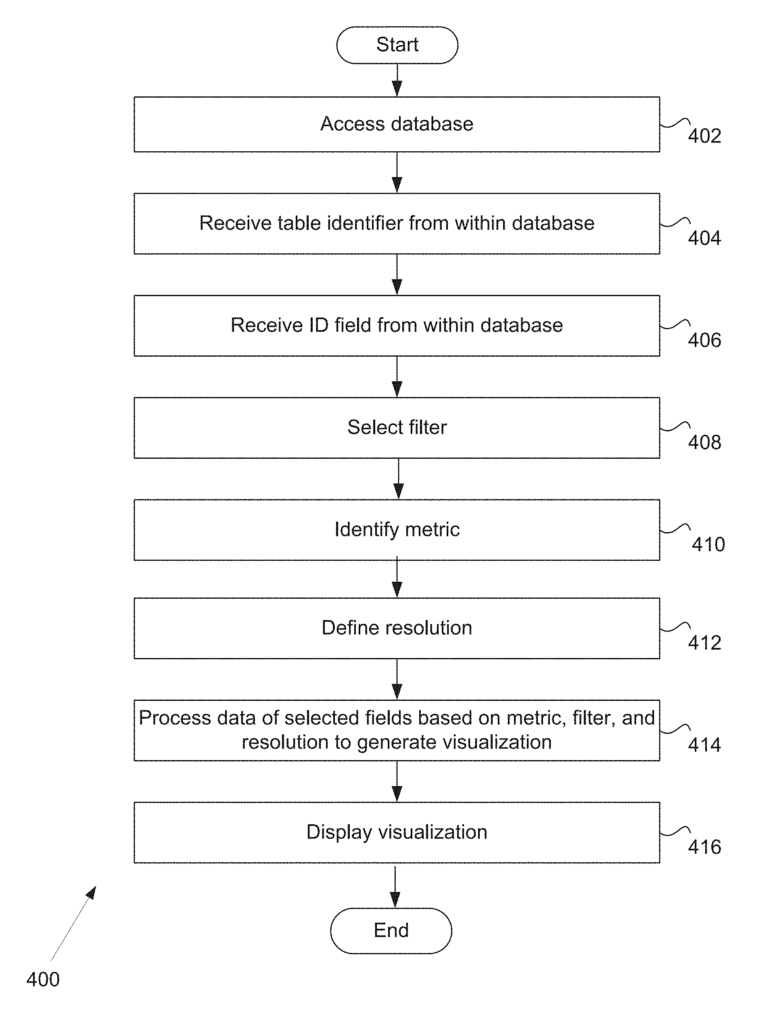
The method includes receiving data from a worksheet, mapping the points to a space reference, creating a cover for the space reference, clustering each data point to determine a node in a graph. Each node has at least one point of data, generating an image of the nodes with edges between each pair of nodes sharing at least one point of data, generating translation data structures indicating the location of each data point in the sheet as well as the membership of each of the nodes, detecting the selection of at
![]()
Background for Topological data analysis using spreadsheets
1. “Field of the Invention
The “embodiments” discussed herein are directed at topological data analyses of data contained in a spreadsheet or multiple spreadsheets.
2. “2.
As the amount of data collected and stored has increased, so too has the need to understand and analyze it. Financial services, oil explorations, insurance, biotech and health care are all examples of companies that have large datasets. “Unfortunately, the previous methods of analyzing large multidimensional datasets are often insufficient to identify important relationships or may be computationally inefficient.
Clustering is a method that was used in the past to analyze large datasets. Clustering can break important relationships, and it is not always the best tool to identify important relationships. Similar to previous methods such as linear regression, principal component analysis and multidimensional scale, they often fail to reveal important relationships. The existing analytic and linear algebraic methods are also too sensitive to the large scale distances, and as a consequence, they lose detail.
Even when the data has been analyzed, it is often necessary for sophisticated experts to interpret and comprehend the output from previous methods. The graphs used in some of the previous methods are interactive, but they do not allow for the exploration of relationships. This requires a team to be comprised by experts who can spend considerable time understanding the relationships. The output of the previous methods do not allow for exploratory analysis, where the analysis could be modified quickly to discover new relationships. Previous methods required the formulation of an hypothesis before testing.
The method includes receiving data from a worksheet, receiving a lens-function identifier and a metric-function identifier and receiving the respective identifiers. It then involves mapping the data from the sheet to a reference area using the lens function, creating a cover for the reference area using the resolution identifier and clustering the data mapped to the space to determine the nodes. In some embodiments the method also includes detecting the selection of a secondary set of data in the spreadsheet. It then determines a set nodes that are included in the visualization and provides a command to an analytical system to provide a visual identification for the second set.
The method can also include a number of other steps, such as determining the value of a particular node based, at least partially, on its dimension value. A third command is then given to the analysis system, which colors the nodes based on this range. The node associated with the first visual node may be determined by determining the data that is a member of that node. This can then be followed by determining the dimension entries for all the data that are a part of that node and finally averaging these entries to determine the node. The method can also include determining a color legend that indicates the colors associated with a portion of the values range and providing a 5th command to display the legend.
The method can further include generating explain data indicating the significance of at least one subset of dimensions of the data points which are members of selected nodes and providing a sixth instruction to the spreadsheet application in order to generate a spreadsheet associated with the spreadsheet, and display the explain information. Calculating a p-value for the at least continuous dimension of at least one spreadsheet dimension may be part of generating the explain information. In order to determine if a certain dimension is continuous, it may be necessary to check if the dimension values for the one or more dimensions for at the least the nodes that correspond with the nodes in the spreadsheet are quantitative and to verify that the number of distinct dimension value for the one or more dimensions for the nodes that correspond with the nodes in the spreadsheet are greater than the continuous threshold. Calculating a p-value for a single dimension of the one dimension which is the categorical one can be part of the process of generating the explain information. If the at-least one dimension of the spreadsheet is a category dimension, it may be determined by determining whether dimension values for the at-least one dimension that corresponds to the data in the selected nodes have qualitative values. If the spreadsheet has at least one categorical dimension, it can be determined by determining if the number of distinct dimensions values for the at the least data points that corresponds to the selected data points is below a threshold of categorization.
The method may include receiving data points from a spreadsheet, receiving a lens function identifier, a metric function identifier, and a resolution function identifier; mapping the data points from the spreadsheet to a reference space utilizing a lens identifier; generating a cover of a reference space using a resolution The method can include receiving data from a worksheet, receiving a lens-function identifier and a metric-function identifier and receiving a resolution-function identifier. It may also comprise receiving a cover for the reference area using a resolution-function identifier and clustering the mapped data using the cover. The method may also include detecting the selection of a secondary set of data in the spreadsheet. It can then determine a set nodes that are included in the visualization and provide a visual identification for each of these data points.
The example system can include one or more processors, and memory with instructions. At least one processor may execute the instructions to: receive data from a worksheet, receive a lens-function identifier and a resolution-function identifier; map the data from the sheet to a reference area using the lens function identification; generate a cover for the reference area using the resolution identifier; cluster the data mapped to reference space by using the cover, use a metric-function identifier and the metric-function identifier to determine a node from a plurality, each including at the spreadsheet.
Some embodiments of this invention may be part of Topological Data Analysis” (TDA). TDA is a research area that has developed methods for studying point clouds from a geometric point of view. Other data analysis techniques use “approximation using models” There are many types of models. Other data analysis methods include regression techniques, which represent data as a graph representing a function of one or more variables. “Unfortunately, certain qualitative features (which can be easily observed when the data are two-dimensional) could be very important for understanding and may not be represented in such models.
FIG. “FIG. 1A shows an example graph that represents data that seems to be divided up into three disconnected groups. The data in this example may be related to various physical characteristics of different populations or biomedical information related to different types of disease. Once one knows what makes up the groups, it can be helpful to see how the data is broken down.
FIG. The graph in Figure 1B represents a data set derived from the Lotka-Volterra model of populations of prey and predators over time. Figure 1B shows the data set obtained from a Lotka-Volterra equation that models populations of predators and prey over time. One observation of this data can be made from FIG. The loop isn’t exactly circular but is a topological circle. While the exact form of equations is interesting, it may not be as important as the qualitative observation that reflects the fact the the underlying phenomena is periodic or recurrent. Methods can be developed to detect loops in periodic or recurrent phenomena without having explicit models. It is possible to detect periodicity without first developing a model that accurately represents the dynamics.
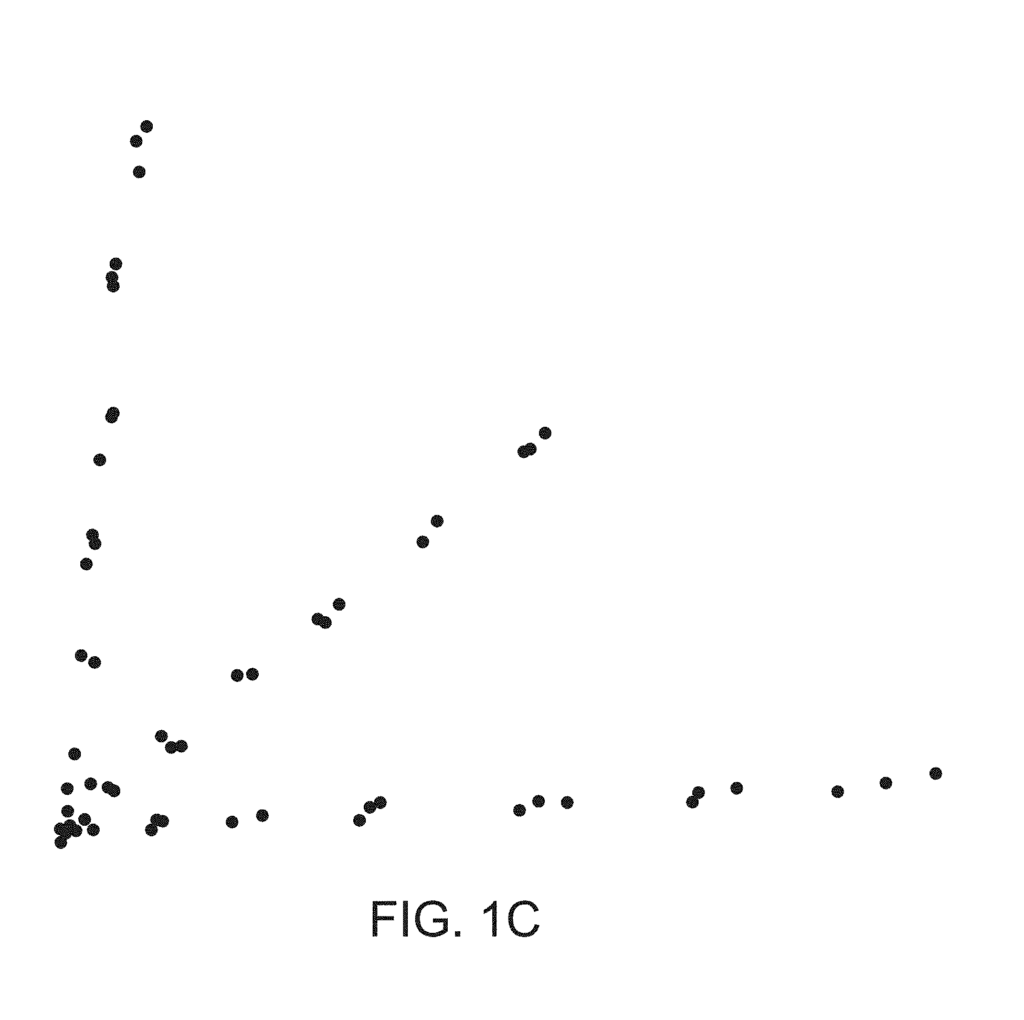
FIG. The graph 1C shows a data set that does not have disconnected groups but has a structure with lines (or flares), emanating from the central group. The data in this case also indicates the presence of three distinct groupings, but their connectedness does not reflect that. This data is used to create the graph shown in FIG. The data for 1C is derived from a study on single nucleotide Polymorphisms.
In each of the above examples, the shape of data is relevant to reflect information about data. The connectedness of the shape (the most basic property) indicates that the data are classified into discrete groups. Another simple shape feature, loops, can often be used to represent periodic or recurring behavior. In the third example, a shape with flares indicates a classification that describes how phenomena can differ from the norm. This would be typically represented by a central core. These examples show that data shape (properly defined) is a very important part of its structure and it is important to understand and analyze its shape. Topology is the part of mathematics that deals with shape. Topological data analysis tries to adapt the methods developed for studying shape in pure mathematics to data.
The question that arises is: How do notions of shape or geometry translate into information about finite point clouds? Shape or geometry is a function of dissimilarity or metric. (For example, a nonnegative, symmetrical, real-valued d function on the set pairs of points within the data set that may also satisfy triangle inequality and d(x, y)=0 only if and when x=y). Many data sets have such functions. When data is presented in the form a numerical matrix where the rows are data points, and the columns the fields that describe the data, then the n-dimensional Euclidean Distance function makes sense when there are n data fields. In this example there are also cosine and Pearson correlation distances.
When the data isn’t Euclidean (for example, if you are looking at genomic sequences), various notions of proximity can be defined by using scores of Basic Local Alignment Search Tool type similarity. A measure of similarity may also be non-numerical, for example, social networks, hobbies, purchasing patterns, tweeting and/or professional interest. The notion of shape can be expressed in any of these ways by establishing a useful notion for similarity between data points.
One of TDA’s advantages is that it may rely on nothing else than this notion, a low-level or primitive model. TDA, for instance, may be based on fewer assumptions than traditional linear or algebraic model. The methodology can also provide new ways to visualize and compress data sets that facilitate the understanding and monitoring of data. The methodology may enable study of interrelationships among disparate data sets and/or multiscale/multiresolution study of data sets. The methodology can also be used to interact with data using click and point methods.
In some embodiments, TDA can be an excellent complement to other methods such as Principal Component Analysis, multidimensional scaling and hierarchical grouping. The existing methods, while often very useful, have significant limitations. PCA is a linear procedure, and its use in non-linear situations has limitations. Multidimensional scaling, which is not linear by nature, can wash out details in some situations, as it tends to overweight large distances. It may also have trouble accurately representing data when metrics don’t satisfy the intrinsic flatness requirement. Hierarchical Clustering exhibits multiscale behavior but only represents data as disjoint groups, not retaining the geometry of the dataset. These limitations are relevant for a wide range of data types in all four cases.
We now summarize the example properties of a construction that, in certain embodiments, may be used to represent data sets in an understandable and useful manner as a finite Graph:
Click here to view the patent on Google Patents.
Leave a Reply