Invented by Larry R. Dust, David B. Cook, Quality Healthcare Intermediary LLC
The Quality Healthcare Intermediary LLC invention works as follows
The invention provides a method for optimizing the consumption of healthcare services. It includes assessing the health situation of an employer who offers healthcare benefits to a particular population, identifying patients from that population who are likely to generate costly healthcare claims on the basis of past claims data, periodically determining if patients in this first group have met certain predetermined requirements, identifying first providers who offer high-quality, cost-efficient healthcare services on the basis of their practice patterns, encouraging patients who do not meet the predetermined requirements to seek services from the first

Background for Method for optimizing the consumption of healthcare services
The benefits provided by employers to their employees and families are invaluable. These benefits are typically a large part of the total operating costs for an employer. As medical costs rise, so will the cost to provide employer-sponsored healthcare benefits.
At present, employers are trying to offset rising healthcare costs by shifting them to their employees. There is a limit to how much can be transferred from employers to employees. The cost of healthcare for employees will eventually become prohibitive. Employer sponsored healthcare will cease to be a benefit. Cost information can be useful for some employers, but it is not very valuable without any information about the quality of services. Some employers have tried to cut their healthcare costs by sponsoring wellness screenings or health fairs. While this approach is somewhat effective at encouraging preventative healthcare, it does not represent a targeted expenditure of resources. The money spent on wellness checks is wasted for the vast majority of healthy employees. Final, employers will sometimes try to negotiate fixed costs related to administering healthcare benefits. Since these costs are typically a small part of the total cost for employers, any successful negotiations will only have a minimal impact.
In summary, employers have failed to achieve their goal of controlling healthcare costs and ensuring high-quality care. The information employers lack is essential to identify and quantify the factors that affect their healthcare costs. They also need to compare and evaluate the performance of their healthcare providers.
The present invention is a method for optimizing the consumption of healthcare services through an analysis of demographic and wellness characteristics in a population of employees (including employee and family members, hereinafter referred to as “patients”). The method includes the steps of assessing the healthcare situation of the employer in relation to normative characteristics of a health economic zone including the patients. It also includes an analysis of quality and cost-efficiency of the provider practices used by the patient population, as well as intervention with the patient and the provider. This will improve the overall wellbeing of the patients and their practices, while improving the cost-efficiency of the employer’s provided healthcare plan. In one embodiment, the method includes the following steps: assessing the employer’s healthcare situation in relation to the normative characteristics of an economic zone, including the patients; identifying those patients likely to generate costly healthcare claims compared to the rest of the population based upon data from past claims made by these patients; periodically determining if they have received healthcare services that meet predetermined criteria; identifying qualified healthcare providers in the economic zone that provide high-quality, cost-efficient healthcare services based upon data from past practice patterns by the providers;
The following description, along with the accompanying drawings, will make it clear to anyone who is familiar with the subject what the features and benefits of the invention are.
The embodiments are only exemplary, and not meant to limit the invention in any way. The embodiments have been chosen to allow someone of ordinary skill to practice the invention.
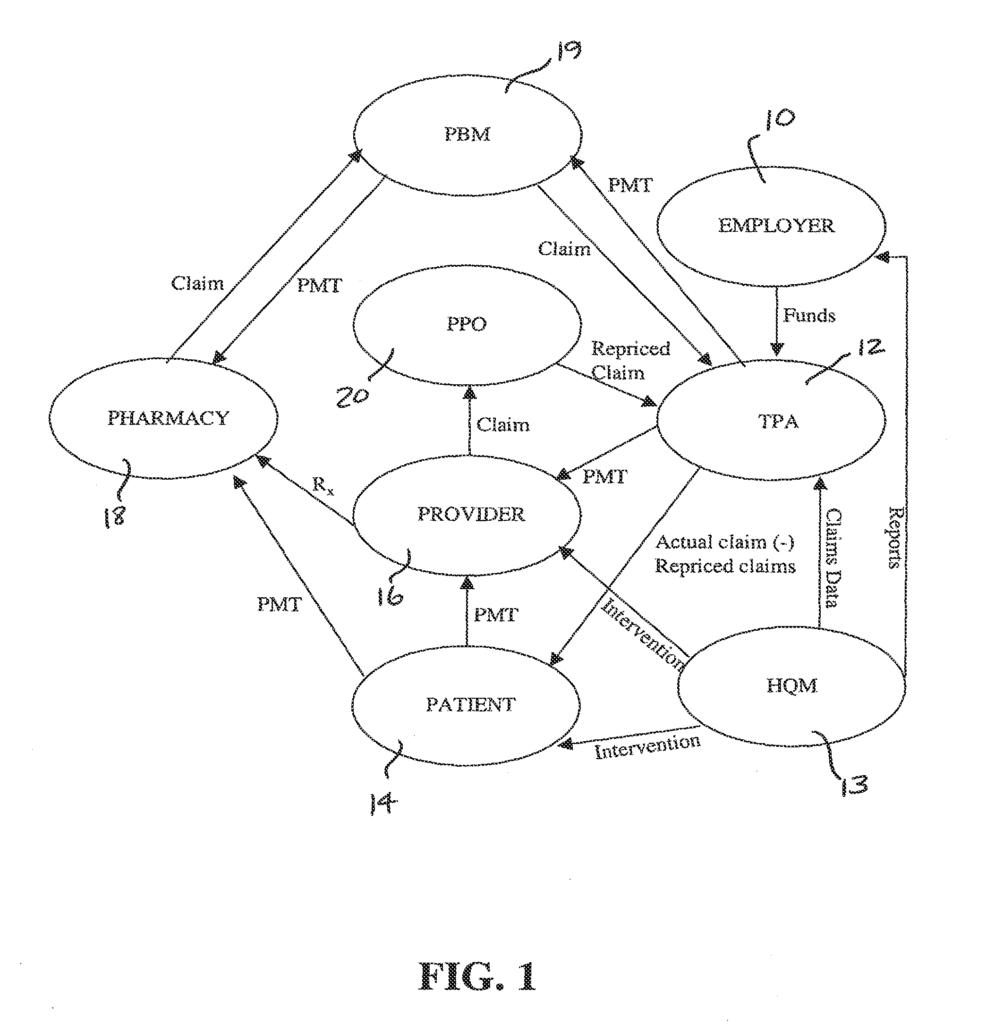
FIG. The relationship between participants in an employer-provided healthcare scenario is shown in Figure 1. In this example the employer 10 provides funds to a third-party administrator (TPA) for healthcare benefits based on estimated healthcare costs. This money is used to pay employee healthcare claims. This relationship also involves the healthcare consumer (patient 14), the healthcare provider (16) (e.g. a doctor or facility like a hospital, lab, etc.), and the healthcare quality management firm (HQM 13). Pharmacy 18, pharmacy benefit manager (PBM) 19, PPO 20 and healthcare quality management company (HQM 13) are all involved in this relationship. It should be clear from the description that HQM 13 can perform the same functions as TPA 12. Unless otherwise stated or required by context, references to HQM 13, including HQM 13, may also include TPA 12.
In a typical transaction associated to a healthcare claim the patient 14 visits provider 16, in order to obtain products and/or services such as drugs. This description refers to both services and products collectively as healthcare services. The provider 16 submits an invoice to TPA 12, or PPO 20, in the amount of the services. The provider 16 can also write a script that is received by pharmacy 18. The pharmacy 18 will then submit a claim for reimbursement to PBM 19, who in turn will submit a request to TPA 12. In the industry, it is common knowledge that PPO 20, or alternatively TPA 12, will typically discount or reprice the claimed charges in accordance with an agreement between PPO 20, pharmacy 18, and provider 16. TPA 12 is notified of the repriced claim. TPA 12 uses funds from the employer’s healthcare account to pay provider 16 for the repriced claims. PBM 19 forwards the payment to pharmacy 18. TPA 12 informs the patient 14 about the payment obligation that the patient has as a result of the terms and conditions of the benefit plan underlying the claim when the TPA does not cover 100% of the eligible charges. Patient 14 sends payment to provider 16. This example assumes TPA 12 is distinct from HQM 13 If HQM 13 is a combination between HQM 13 (TPA 12) and HQM 13, then HQM 13 will interact directly with the employer 10, patient 14, and provider 16 in the same manner as described above with regard to TPA 12.
As should be evident from the above, TPA 12 is able to access all material claim information throughout each transaction. TPA 12 may share this information with HQM 13 which can contact the employer 10, patient 14 and/or provider 16 to discuss. As will be explained in detail below, the HQM 13 can facilitate a change and/or influence directly the healthcare situation in order to control costs incurred by the employer 10 and encourage the consumption of high-quality providers 16. HQM 13 will be described as a company that provides a service to its clients, employers 10 and patients 14, including their employees and family members.
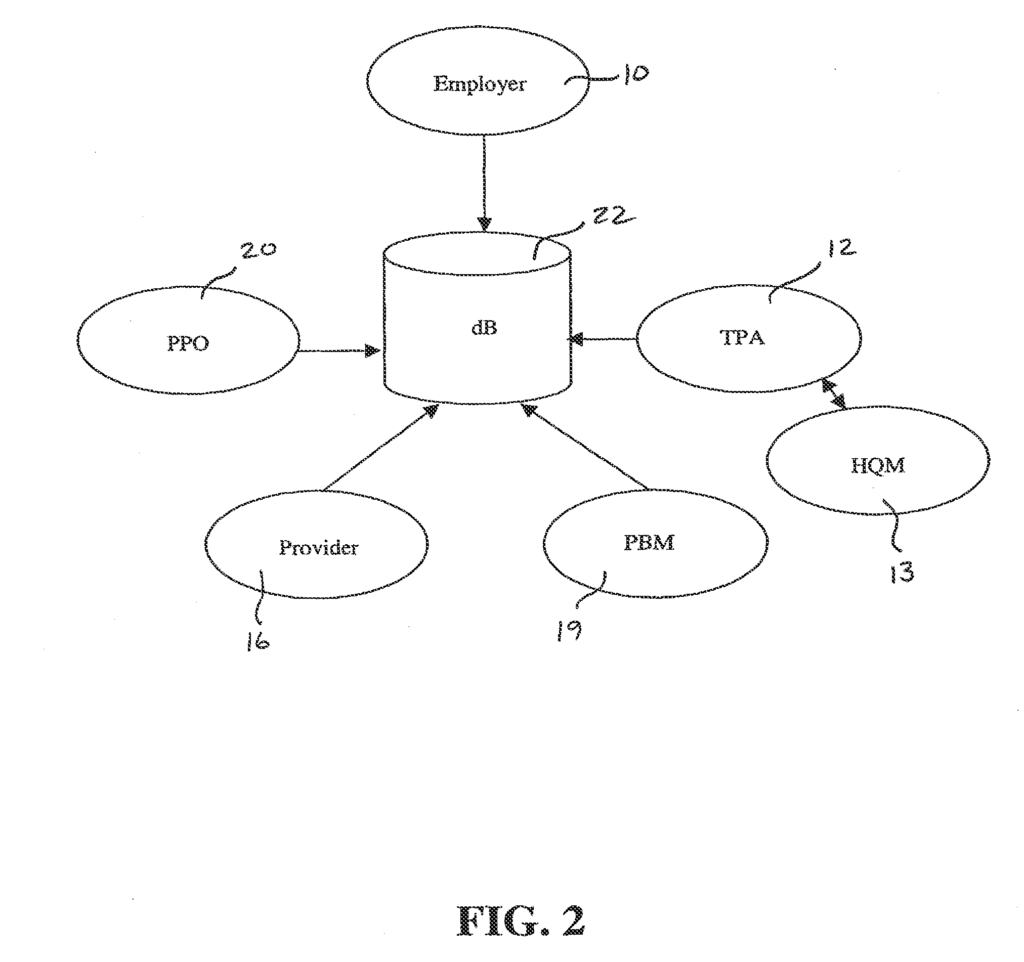
According to one embodiment, TPA 12 keeps a database 22, which includes a variety of information types from the employer 10, provider 16, PBM 19 and PPO 20, as shown in FIG. 2. TPA 12 updates the information in database 22 due to its interaction with HQM 13 as described further below. Database 22 can be stored on a wide range of computer-readable media, such as the hard drive of a PC. Although FIG. While FIG. TPA 12 can receive information from other participants, and then enter or otherwise process it for storage in database 22, rather than the other participant providing the information directly. Information may, for example, be electronically transferred from employer 10, provider 16 and PBM 19 to TPA 12, via multiple networks. TPA 12 can be physically located in multiple locations. Each location receives data from other participants. These multiple locations can be connected via a network that allows simultaneous access to the database 22 by a server. The invention covers any suitable method for transferring and storing information, whether in a distributed or centralized database 22. To simplify the description, information transfer is described in this document as taking place electronically over a computer network. Database 22 is then described as a central database that can be accessed by only one TPA 12.

As will be described in more detail below, the data stored in database 22 allows HQM 13 evaluate the healthcare situation for employer 10, including cost information, healthcare characteristics of the patients 14, and performance of the providers 16 used by the patients 14 who are covered by the healthcare plan offered by employer 10. The information stored in database 22 can include information about the employer, patients, providers, pharmacies, claims, or any combination of these. Employer information includes information about employer 10, the patients 14 who are covered by the employer-provided healthcare plan, the PPO 20 that is associated with employer 10, and historical data which characterizes the changes in employer 10’s healthcare over time. Patient information includes name, address and social security number of each 14 patient covered by the healthcare plan provided to employer 10. The provider information includes a number of details such as name, tax identification, address and specialty for a variety of healthcare providers in a wide geographic area, like the United States. As will be described further below, certain portions of provider 10 information is associated with employer 10. These portions correspond with the providers 16 who provide services to patients 14, The pharmacy data contains information that identifies the type, quantity and dosage of medications associated with a prescription for a specific patient 14, as well as their social security number 14. These data allow for the association of prescription drug claims to patients 14. The claims can also be associated with the provider 16, who wrote the prescription, by referring to the data associated with patient 14, the one who filled the script. This will allow you to identify the provider 16 the patient 14 visited before obtaining the prescription. The pharmacy data may also include an identifier that is associated with each prescription to identify the provider 16.
The claim data stored in the database 22 may include parts of the data described above, but they can be organized or grouped with a specific claim. A claim can include information that identifies and/or describes employer 10, pharmacy 18, PBM 19 and PPO 20, as well as patient 14. The claim can also include information about the symptoms or condition of patient 14, the diagnosis made by provider 16, and the treatment ordered by provider 16. These are identified by procedure codes and costs.
As mentioned above, information in database 22 is gathered from various sources. When an employer 10 becomes the new client of HQM13, PPO 20 may send HQM13 enrollment data, including information about the employer, employee, and past claims. HQM 13 can then add that information to database 22. PPOs 20, of employers 10, periodically transfer claim information to TPA 12. (i.e. as claims information is being processed by PPOs). This claims information can include, as indicated above, information about healthcare services and employee information. It may also contain provider information and pharmacy information. Also, PBMs 19, or data transfer services that work with PBMs 19, periodically transfer pharmacy information from TPA 12 to PBMs 19. According to the description below, every time TPA 12 receives new information, TPA 12 or HQM 13 can process it so that a specific employer 10, a certain patient 14, or a specific provider 16 is associated.
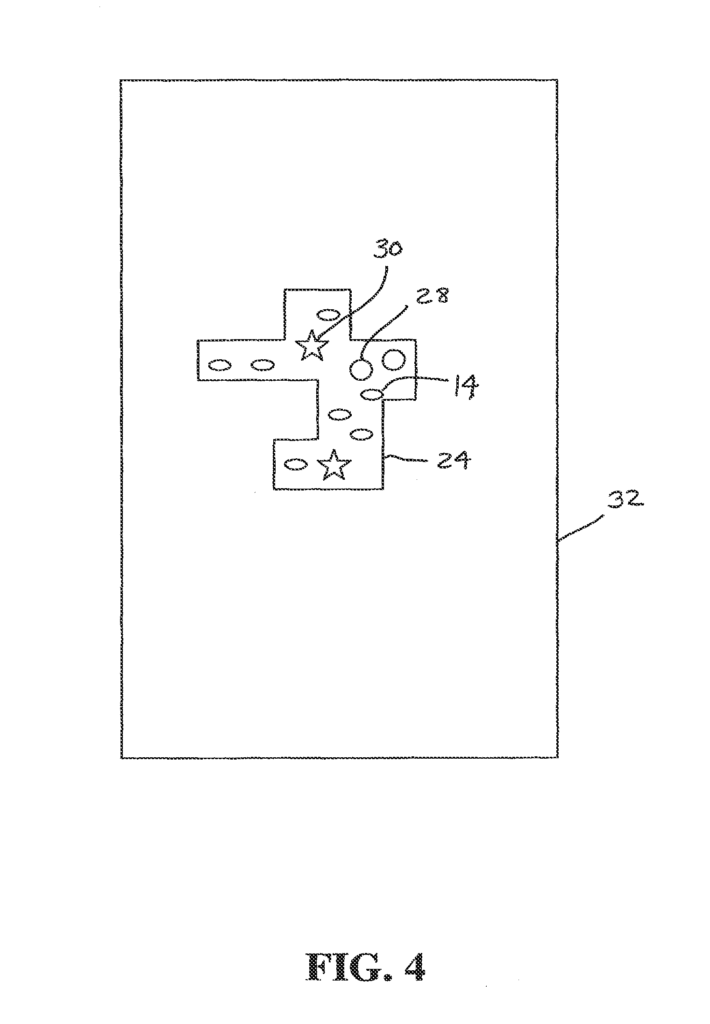
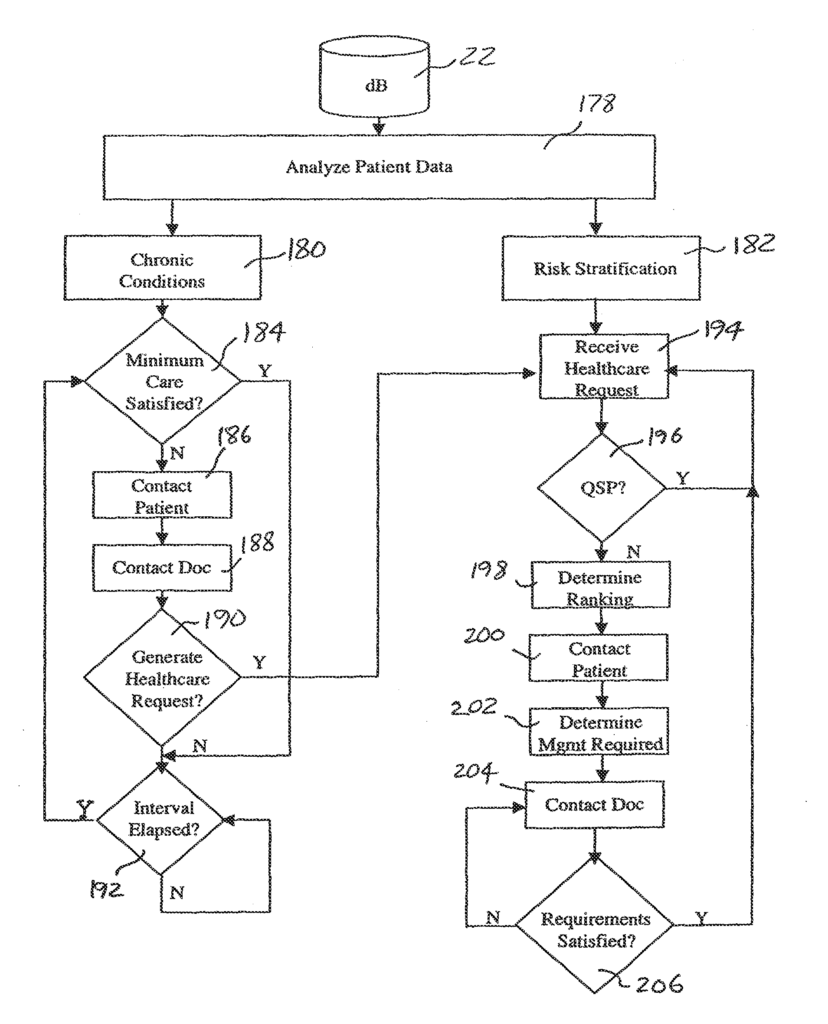
Referring to FIGS. The method of the present invention can be described in general terms as having three basic steps. These are: Analyzing the healthcare situation for the employer 10, improving the characteristics of healthcare consumption of patients 14, improving the performance of providers 16 that patients 14 use. FIG. 10 shows a process for analyzing the healthcare situation of an employee 10. 3. In general, once all the relevant information about employer 10, patients 14, associated with employer 10 and providers 16, used by patients 14, resides in database 22 HQM 13 executes a software (as described further below) to access databases 22 and identify a Healthcare Economic Zones (HEZ 24), FIG. Step 26 is to identify the Healthcare Economic Zone (HEZ 24) that corresponds to employer 10. As shown in FIG. As shown in FIG. HEZ 24 can be defined as Hospital Service Areas, as set forth by the Dartmouth Atlas Project. This is a research project funded by the Center for the Evaluative Clinical Sciences of Dartmouth Medical School. The HEZs are determined by the zip codes for the residential addresses of the patients 14 in the database 22, and the location of providers 16 that service those zip codes. An HEZ 24 is a geographical region where patients 14 are most likely to receive their primary healthcare. If, for example, all patients 14 of employer 10 reside in three zip code areas that are served by a single facility 30 (also located within one zip code), then these three zip codes will be included in the HEZ 24. If facility 30 refers patients 14, for example, to specialist providers 16, in a 4th zip code, that zip code will also be included in HEZ. FIG. FIG. However, it should be noted that HEZs (or their equivalents) can extend across state boundaries.
Referring to FIG. Step 34 of step 3 indicates that the information contained in database 22 for employer 10 (i.e. employer information, patient data, claims information for patients 14 associated to employer 10, and provider data) is analyzed in order to assess the healthcare situation at employer 10. As described further below, in step 36 the data specific to employer 10 is compared with generalized data related to HEZ 24. As shown in FIG. As shown in FIG. As part of the analysis of the healthcare situation for employer 10. Step 44 shows the updating of database 22 when HQM 13 or TPA 12 receives claims information or changes to the population of patients 14, as a result, for example, of new employees hired or leaving employer 10, or changes to the family situations of the employees. The process of analyzing healthcare for employer 10 is continuously updated, as can be seen in the figure. This may lead to the generation of periodic reports by employer 10 and TPA 12 in order to track changes over time in healthcare.
FIG. “FIG. The chart 46 in FIG. The chart 46 of FIG. 5 does not compare information about employer 10 to information about HEZ 24, but it is still an employer report because it gives employer 10 data on the cost of healthcare in the HEZ 24, where employer 10 (or more accurately, the patients 14 associated with the employer 10) reside. Chart 46 has a column for specialty 48, total charges column 50 and total charges at normative cost column 52. It also includes a column for percent of excess charges 54, as well as a column for excess charge per person per year 56. Chart 46 gives employer 10 information about the relative costs (by specialty), of healthcare services in HEZ 24, compared with the costs in an area larger than HEZ 24 (e.g. state 32, Midwest, Southeast, etc.). In this example providers 16 in HEZ24 charged $4,251,526 for cardiology services (columns 50) over a specified time period such as two-years. Column 52 shows the normative cost for these services at $4,488,559, for the same number (14 patients) of healthcare consumers over the same time period. The dollar amounts in Column 52 are calculated by adding up all the cardiology charges in the greater geographic area over the predetermined period, and then dividing that total by the number healthcare consumers. This ‘average cardiology charge for each healthcare consumer’ is then multiplied by the number of healthcare consumers in HEZ 24. Then, multiply this?average cardiology charge per healthcare consumer? by the number HEZ 24 consumers. In column 54 it is shown that HEZ 24 had cardiology costs which were 5.3 per cent below the normative cardiology charge. Column 56 converts the deviation in percentage from the normative charge to a dollar amount divided by the number HEZ 24 healthcare consumers and the number years of the predetermined period.
Line 58 displays the totals of all major practice categories (MPCs) or specialties. Lines 60 and62 show a scenario where HEZ 24 may be serviced by multiple PPOs 20. Due to the fact that all the claims data in database 22 are associated with one PPO 20, charges for all healthcare claims in HEZ 24 can be divided based on which PPO handled the claim. Lines 60 and 62 show the relative usage of PPOs in HEZ 24, the normative usage for each PPO across a larger geographical area (e.g. state 32) in column 52, the cost performance for HEZ 24 in comparison to state 32 in column 54, and the dollar value of this relative performance in dollars per patient per year (column56). Lines 64 and 65 provide similar information about two hospitals that are used by consumers of healthcare in HEZ 24.
As can be seen from the above, employer 10 will easily scan column 50 of total allowed charges to identify the specialties that are most likely to significantly contribute to their overall healthcare costs. Employer 10 can easily identify practice categories with charges that are most different from average or normative rates by examining columns 54 and 56. Employer 10 (and HOM 3) can then isolate the practice groups that are most likely to reduce the employer’s healthcare costs.
Another Employer Report 40 (Chart 68 in FIG. The chart 6 follows the same format of the chart 46 but compares actual healthcare costs for employer 10 with the HEZ 24 typical costs. Chart 68 contains a column for each specialty, a column for total costs, a column for normalized HEZ 24 costs, a column to show the percent of excess, and a column showing the excess costs per person per year. The column 72 shows the total cost employer 10 incurred during a specified time period for each of the specialties listed in the column 70. The normalized amounts shown in column 74 are the costs expected in HEZ 24 by an employer with the same number 14 of patients as employer 10. As an example, if the total cost of cardiology in HEZ24 is $17,122.789, and there are 35,623 consumers of healthcare in HEZ24, then the average cost per consumer for cardiology services in HEZ24 is $480.67. If employer 10 has 150 employees 14, the total expected cost for cardiology (i.e. the normalized costs shown in column 74 of HEZ 24) is $72,100. As shown in column 76, the costs incurred by employer 10 for cardiology services are 23.7% lower than the amount anticipated for an employer of the size and location of employer 10, located in HEZ 24, as indicated. Column 78 shows this percentage as a dollar amount per patient per year.
As is evident from the above, chart 68 can be easily revised to reflect the same information for actual users of particular specialties and not just patients 14 or healthcare consumers in general. If, for example, only nine patients 14 consumed cardiology services during the predetermined period (resulting in $55,000 in total costs), then column 74 can be changed to reflect the amount expected by nine average cardiology service consumers in HEZ 24 within the predetermined period. Columns 76 and 78 will then reflect this difference on a per-life per year and percentage basis.
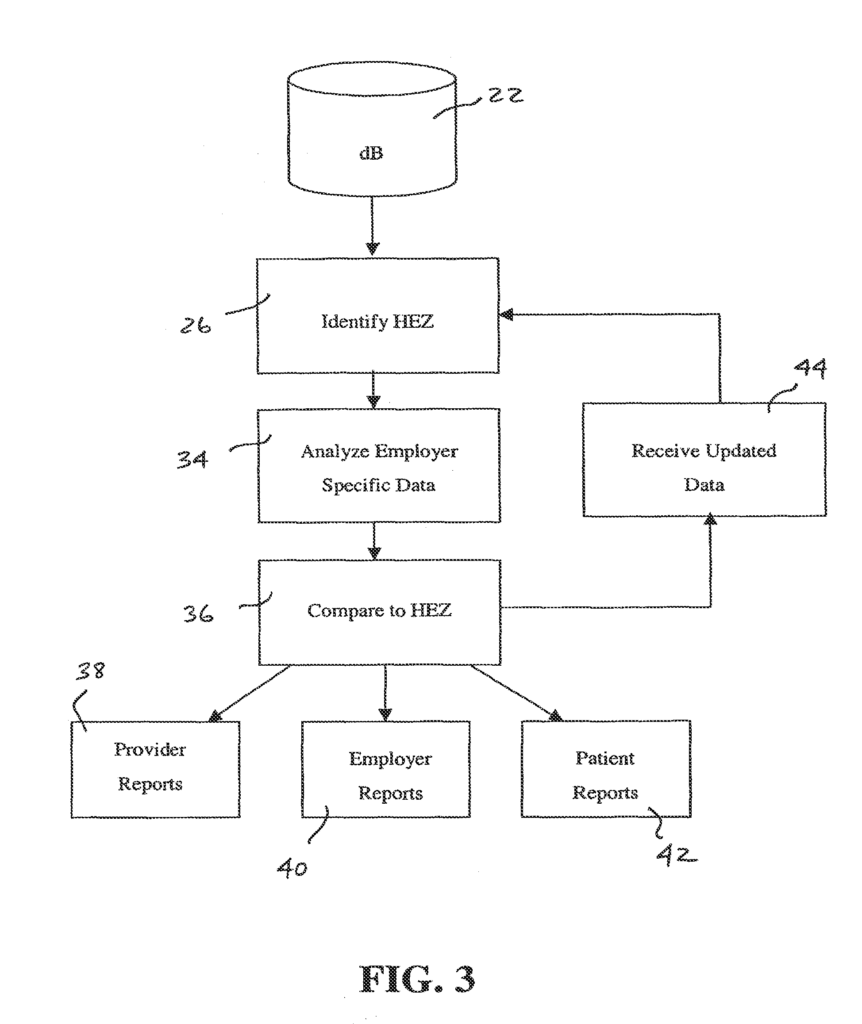

FIG. Another employer report 40 summarizes the demographics and illness burden of HEZ 24 for employer 10. Chart 80 contains a description column, HEZ 24 data, a normative values for a larger geographical area, including column 86, a percent of excess column 88 and an excess per person per year column 1990. The healthcare consumption of adults is higher than that of children (others than newborns), females are more likely to use healthcare services compared to males and older adults consume more healthcare services compared with younger adults. Healthcare consumption is higher for those with certain pre-existing conditions compared to individuals who are healthy. This method uses these factors in order to calculate a healthcare indicator (line 92 of FIG.). The HEZ 24 where patients 14 are associated with employer 10 is shown in Figure 7. The present invention calculates a healthcare index for HEZ 24 based on the Episode Risk Group (ERG), scores that are inherent in the Health Risk Assessment Process provided by Symmetry Health Data Systems, Inc., and described in “A New Approach to Health Risk Assessment”. A white paper is available from Symmetry Health Data Systems, Inc., whose disclosure is hereby incorporated by reference. The healthcare index is calculated for each patient in HEZ 24, using a retroactive analysis. HEZ 24’s index is then derived from the average of all the patients in HEZ. In column 84, FIG. HEZ 24 is composed of 9,808 patients 14, with an average age 42 and 74.8% adult, of which 38.6% are female. This results in an HEZ 24 healthcare index of 1.506. This healthcare index, as shown in column 88 is 50.6% higher than the normative healthcare indicator of 1.0 for the greater geographic area. This high healthcare indicator is due to a higher percentage of women and adults than usual in HEZ 24, and an increased percentage of people with health risk factors. As shown in FIG. 10,8% of the excess is due to an atypical population (i.e. a more female and older population). 39.8% is due to atypical disease burden (i.e. a population that has health conditions higher than normal health risk factors). A HEZ 24 employer should therefore expect higher healthcare costs than those of a larger geographical region. A similar report can be easily generated by comparing the demographics and illness burden of an employer 10 with information about the HEZ 24, where patients 14 are associated with the employer 10.