Category: Patent Prosecution
-
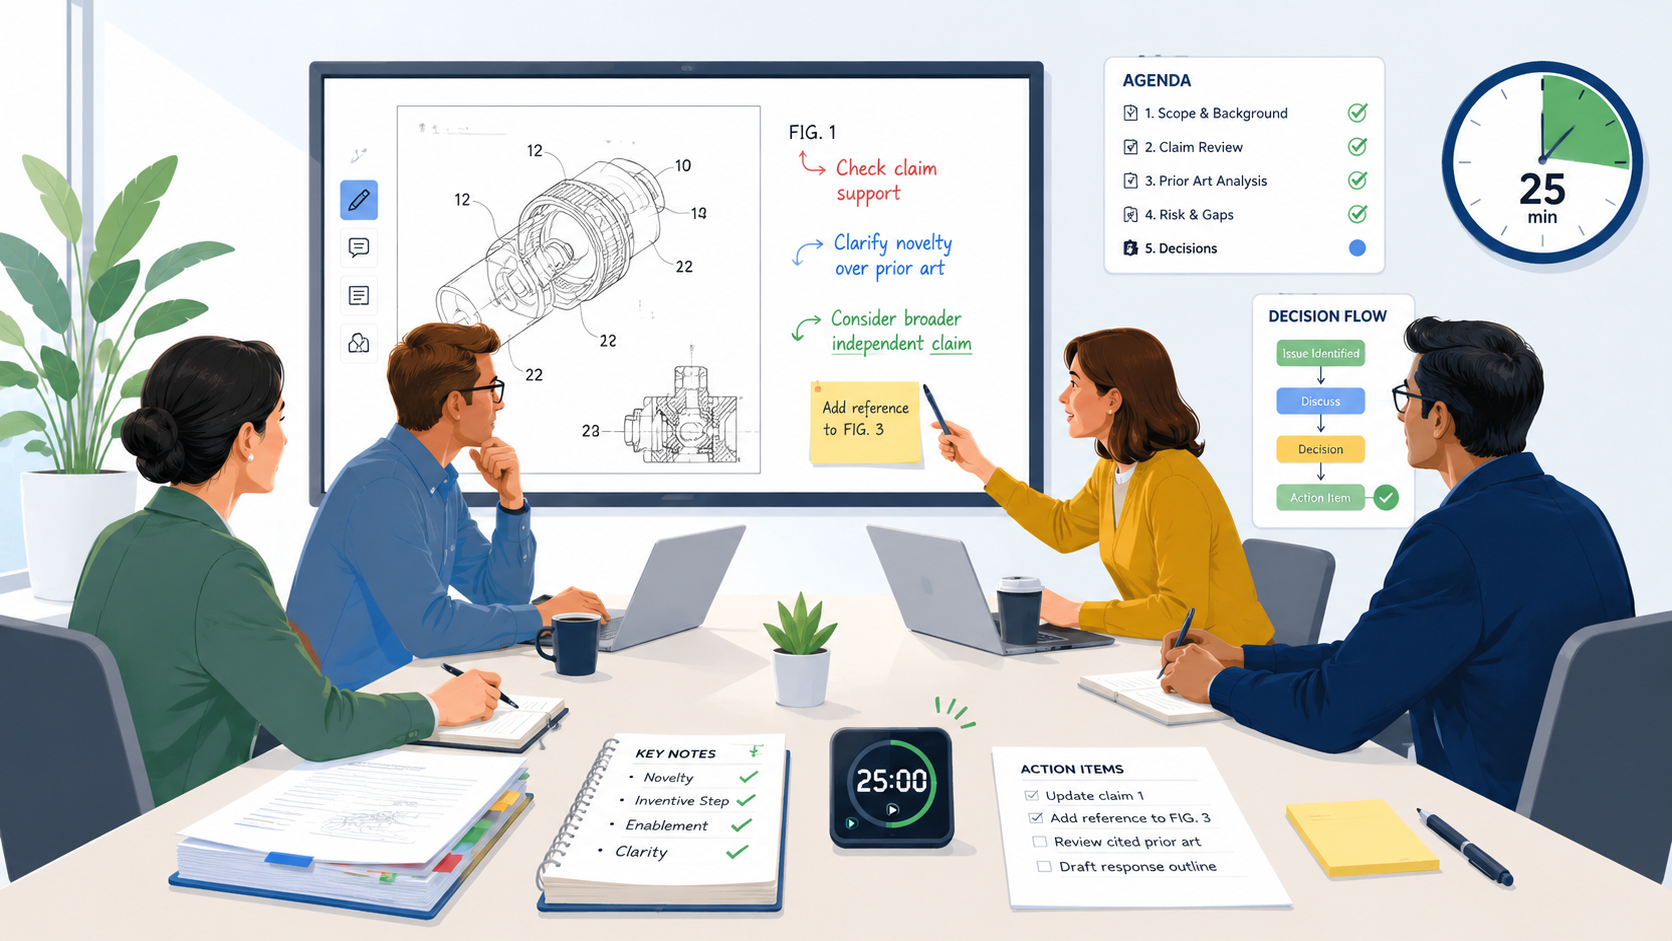
Patent Review Meetings: How to Run Them Without Wasting Time
Patent review meetings should help your team make clear choices fast. PowerPatent helps teams make this process smoother by combining smart software with real attorney oversight, so invention review does not become a slow, messy guessing game. You can see how it works here: https://powerpatent.com/how-it-works Why Most Patent Review Meetings Waste Time Most patent review…
-
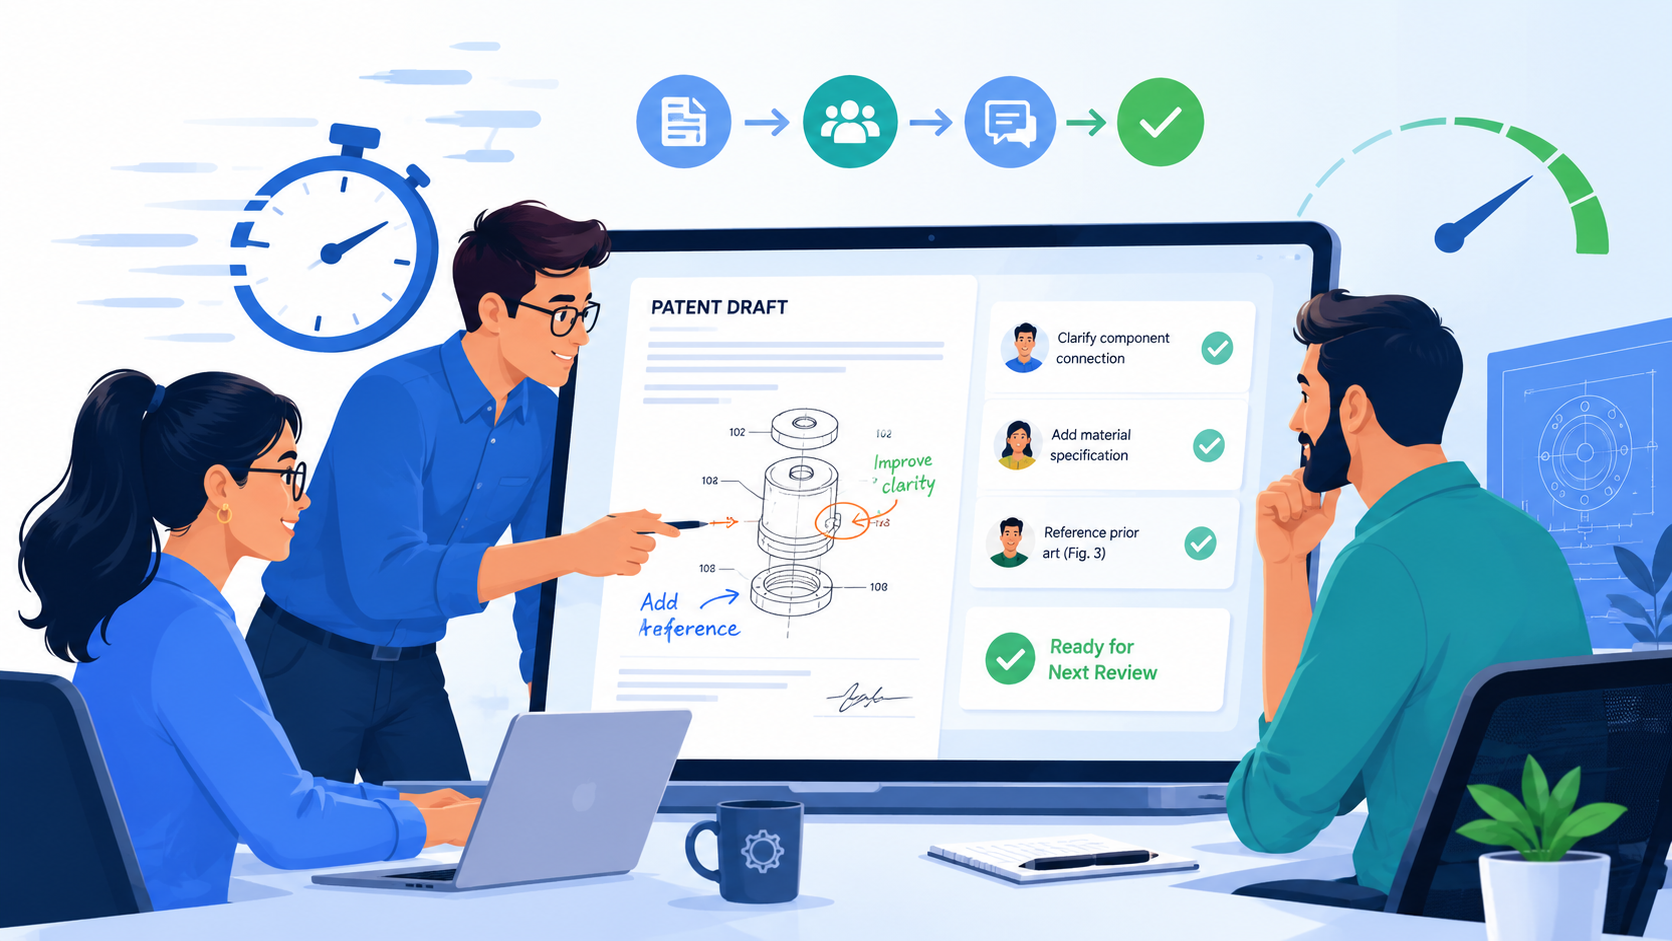
How to Get Engineers to Review Patent Drafts Faster
Patent drafts often slow down for one simple reason: the right engineer has not reviewed the right part at the right time. This guide will show you how to turn patent review from a slow legal task into a fast, simple, team-friendly workflow. PowerPatent helps teams do this with smart software and real attorney oversight,…
-
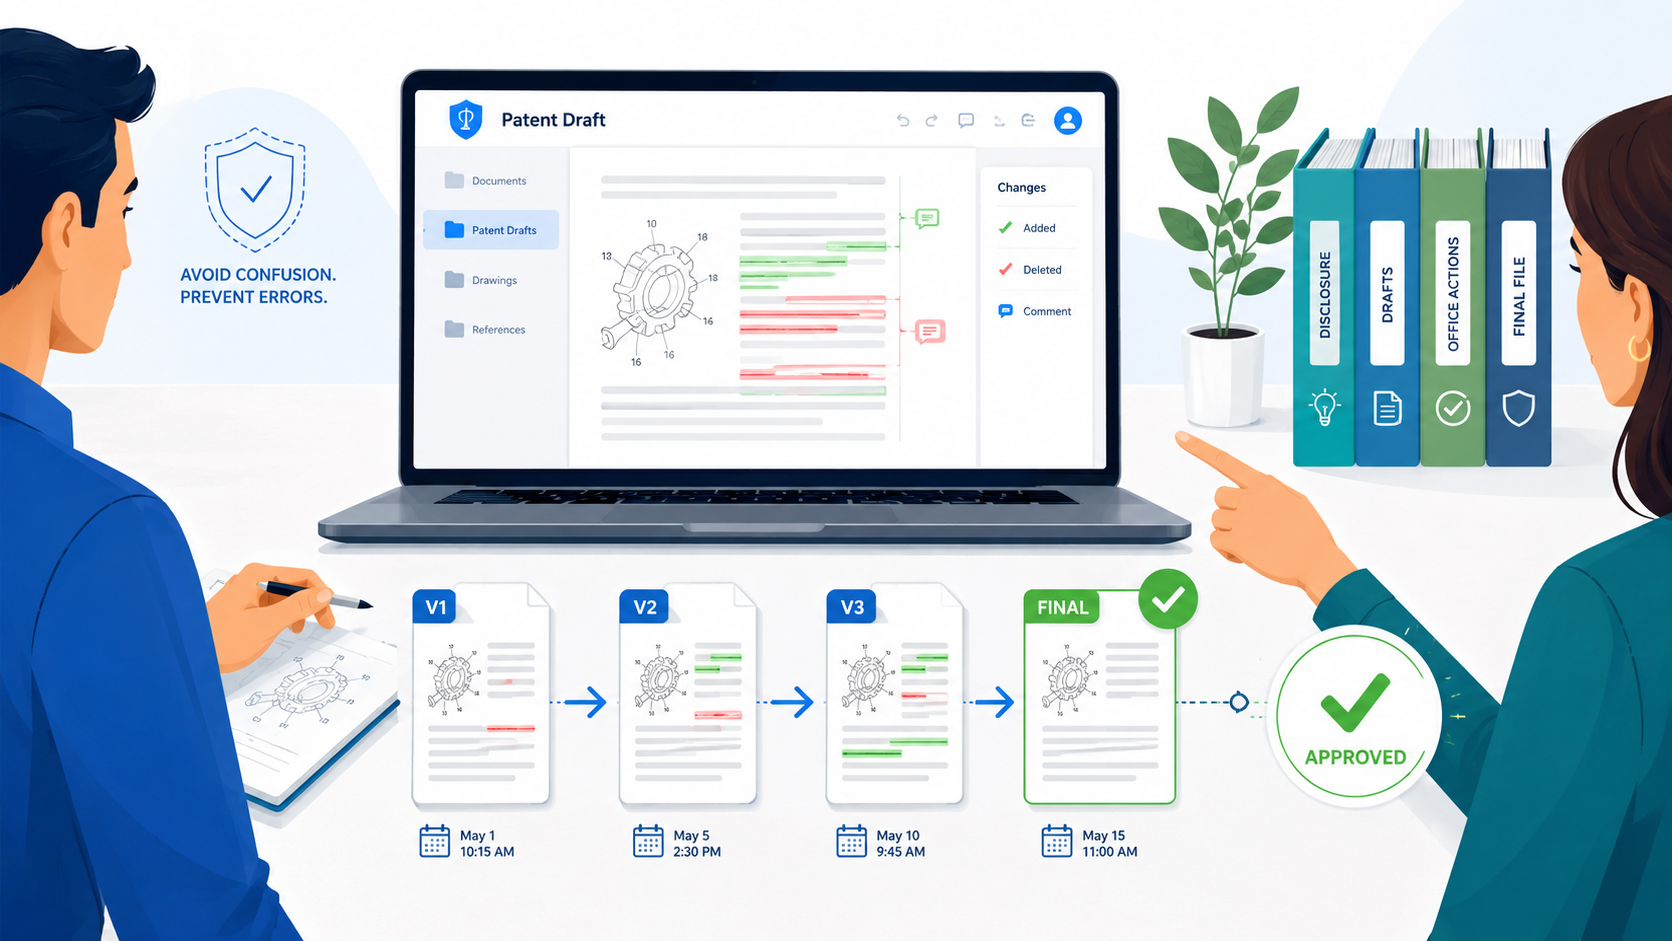
Patent Draft Version Control: Avoid Confusion, Errors, and Missed Changes
A patent draft can change fast. PowerPatent helps founders, engineers, and patent teams keep the process moving with smart software and real attorney oversight, so draft work stays clear instead of chaotic. You can see how it works here: https://powerpatent.com/how-it-works Why Patent Draft Version Control Breaks Down So Fast Patent draft version control breaks down…
-
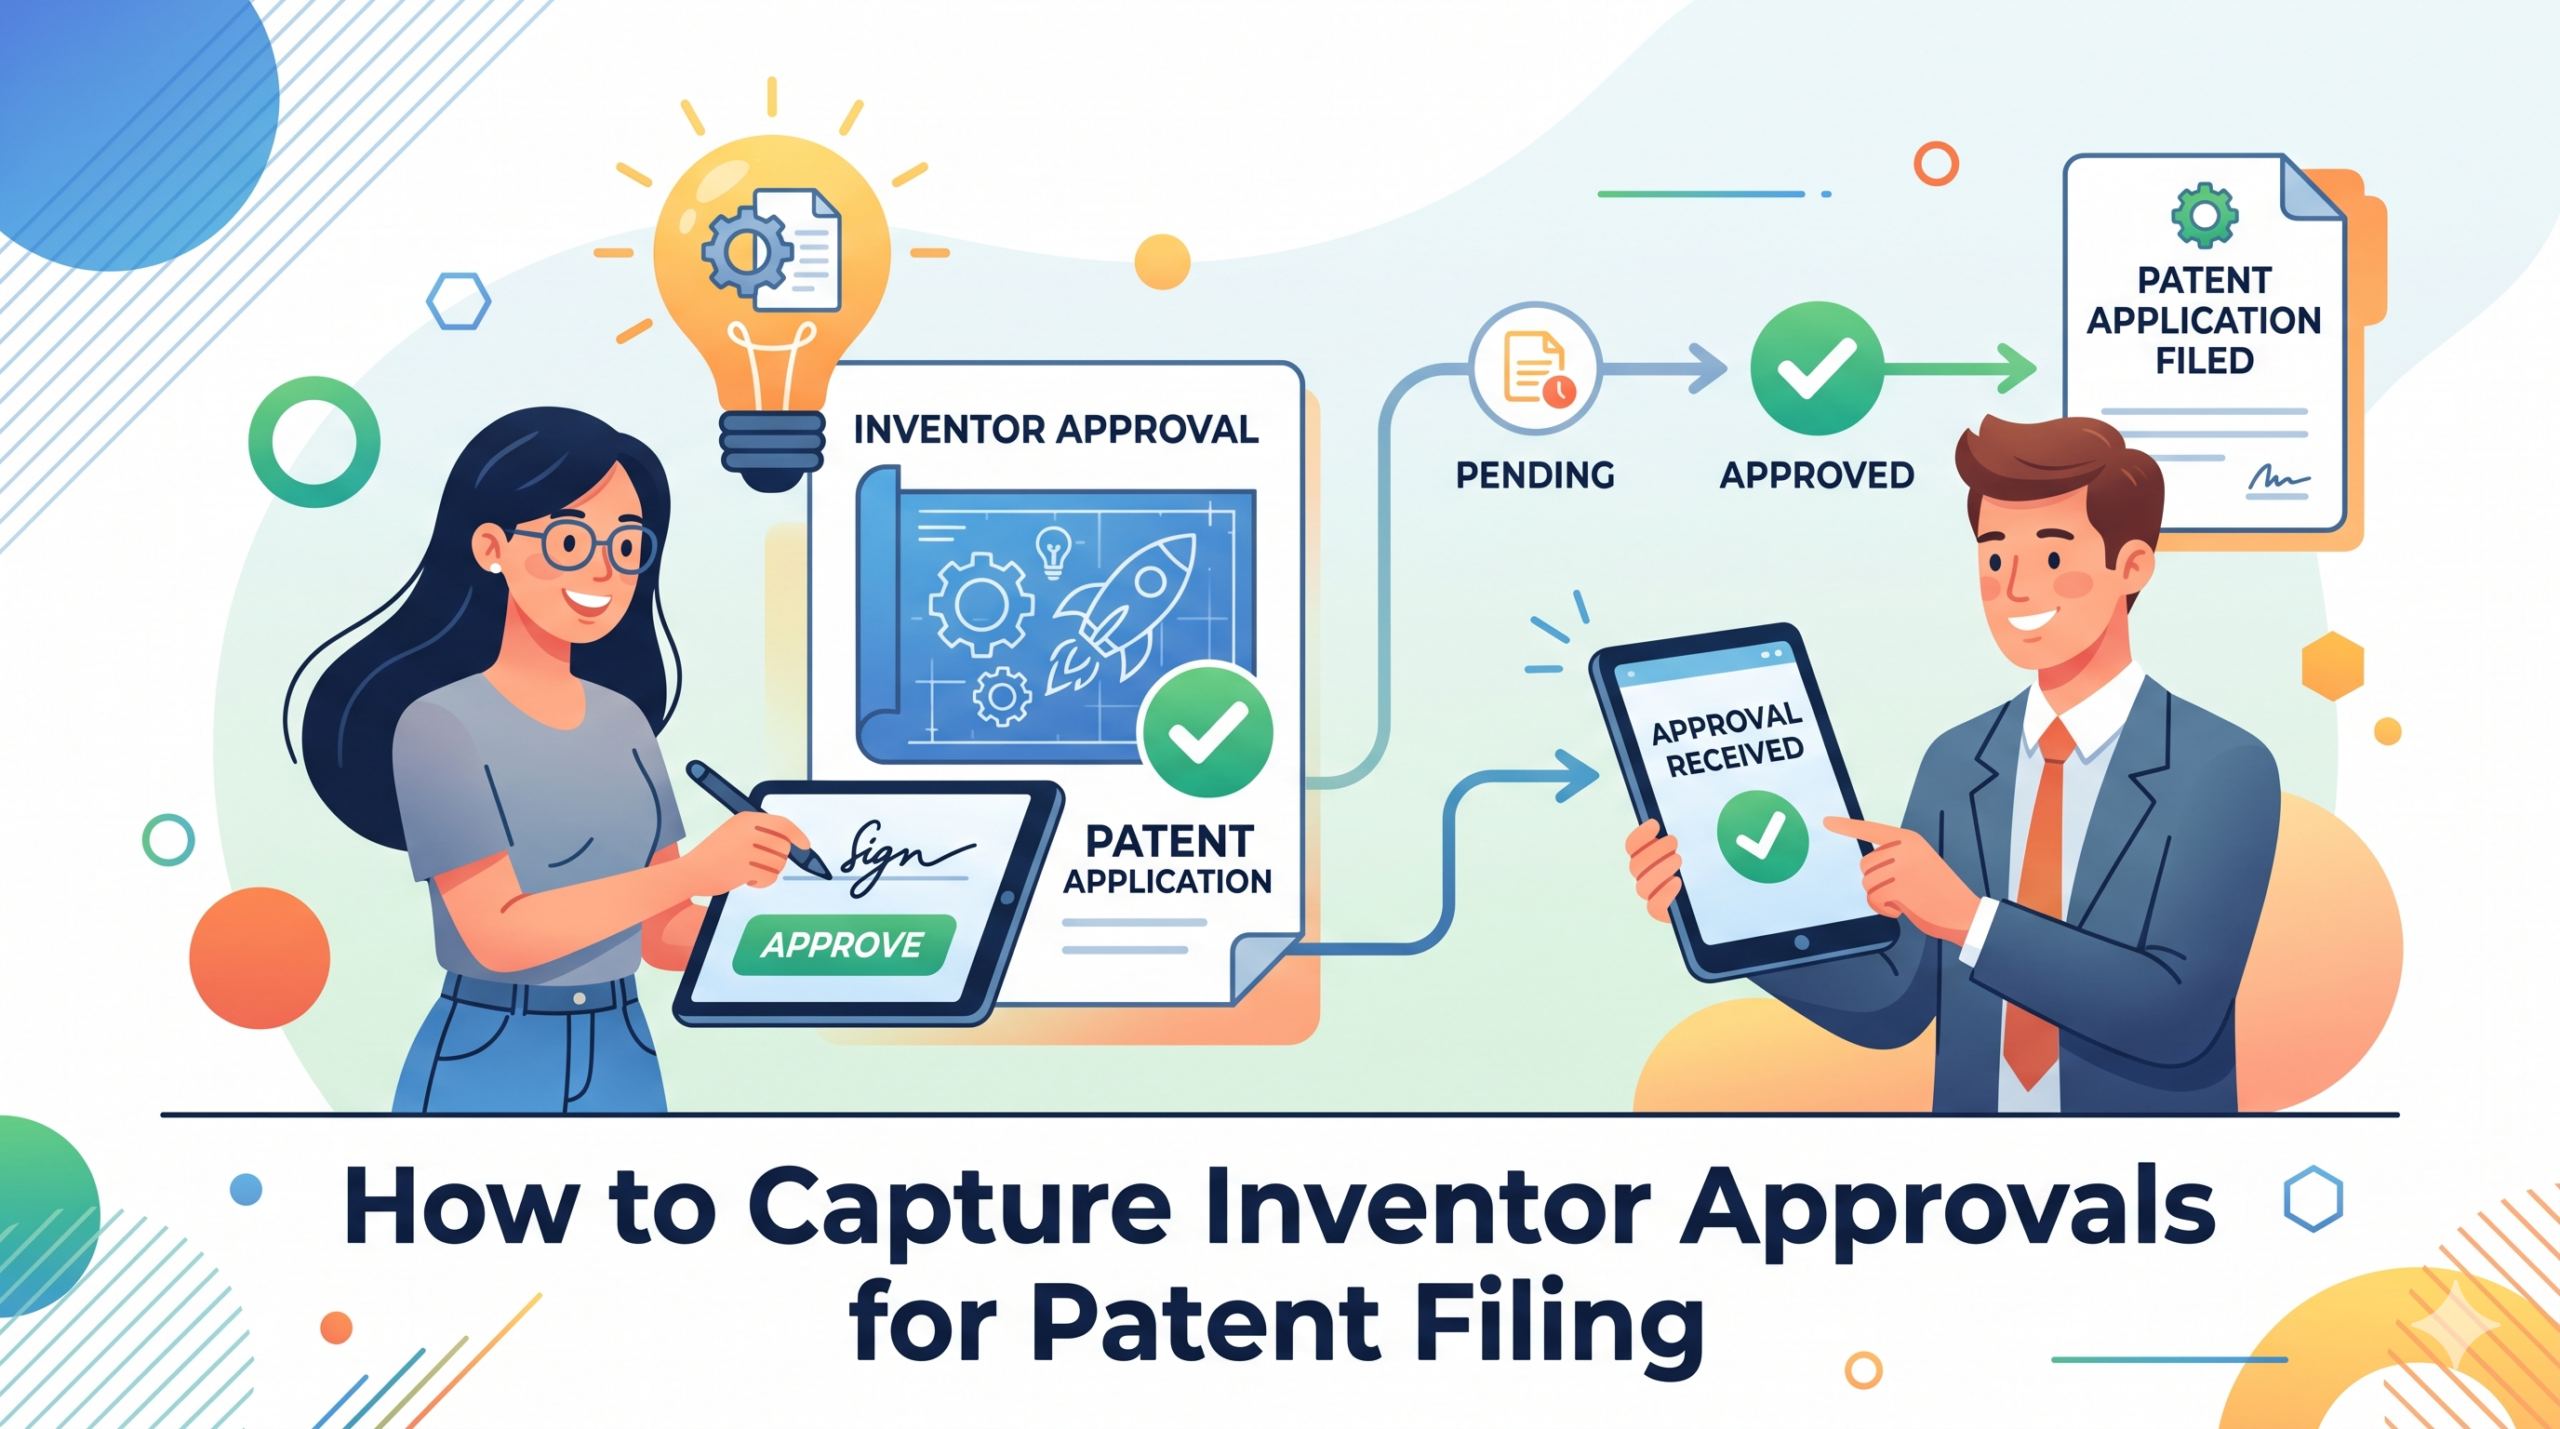
How to Capture Inventor Approvals for Patent Filing
A patent filing can move fast, but one missing approval can slow everything down. In this guide, we will walk through how to capture inventor approvals in a way that is practical, fast, and founder-friendly. Build Inventor Approval Into The Filing Plan From Day One Inventor approval should not be the final step you remember…
-
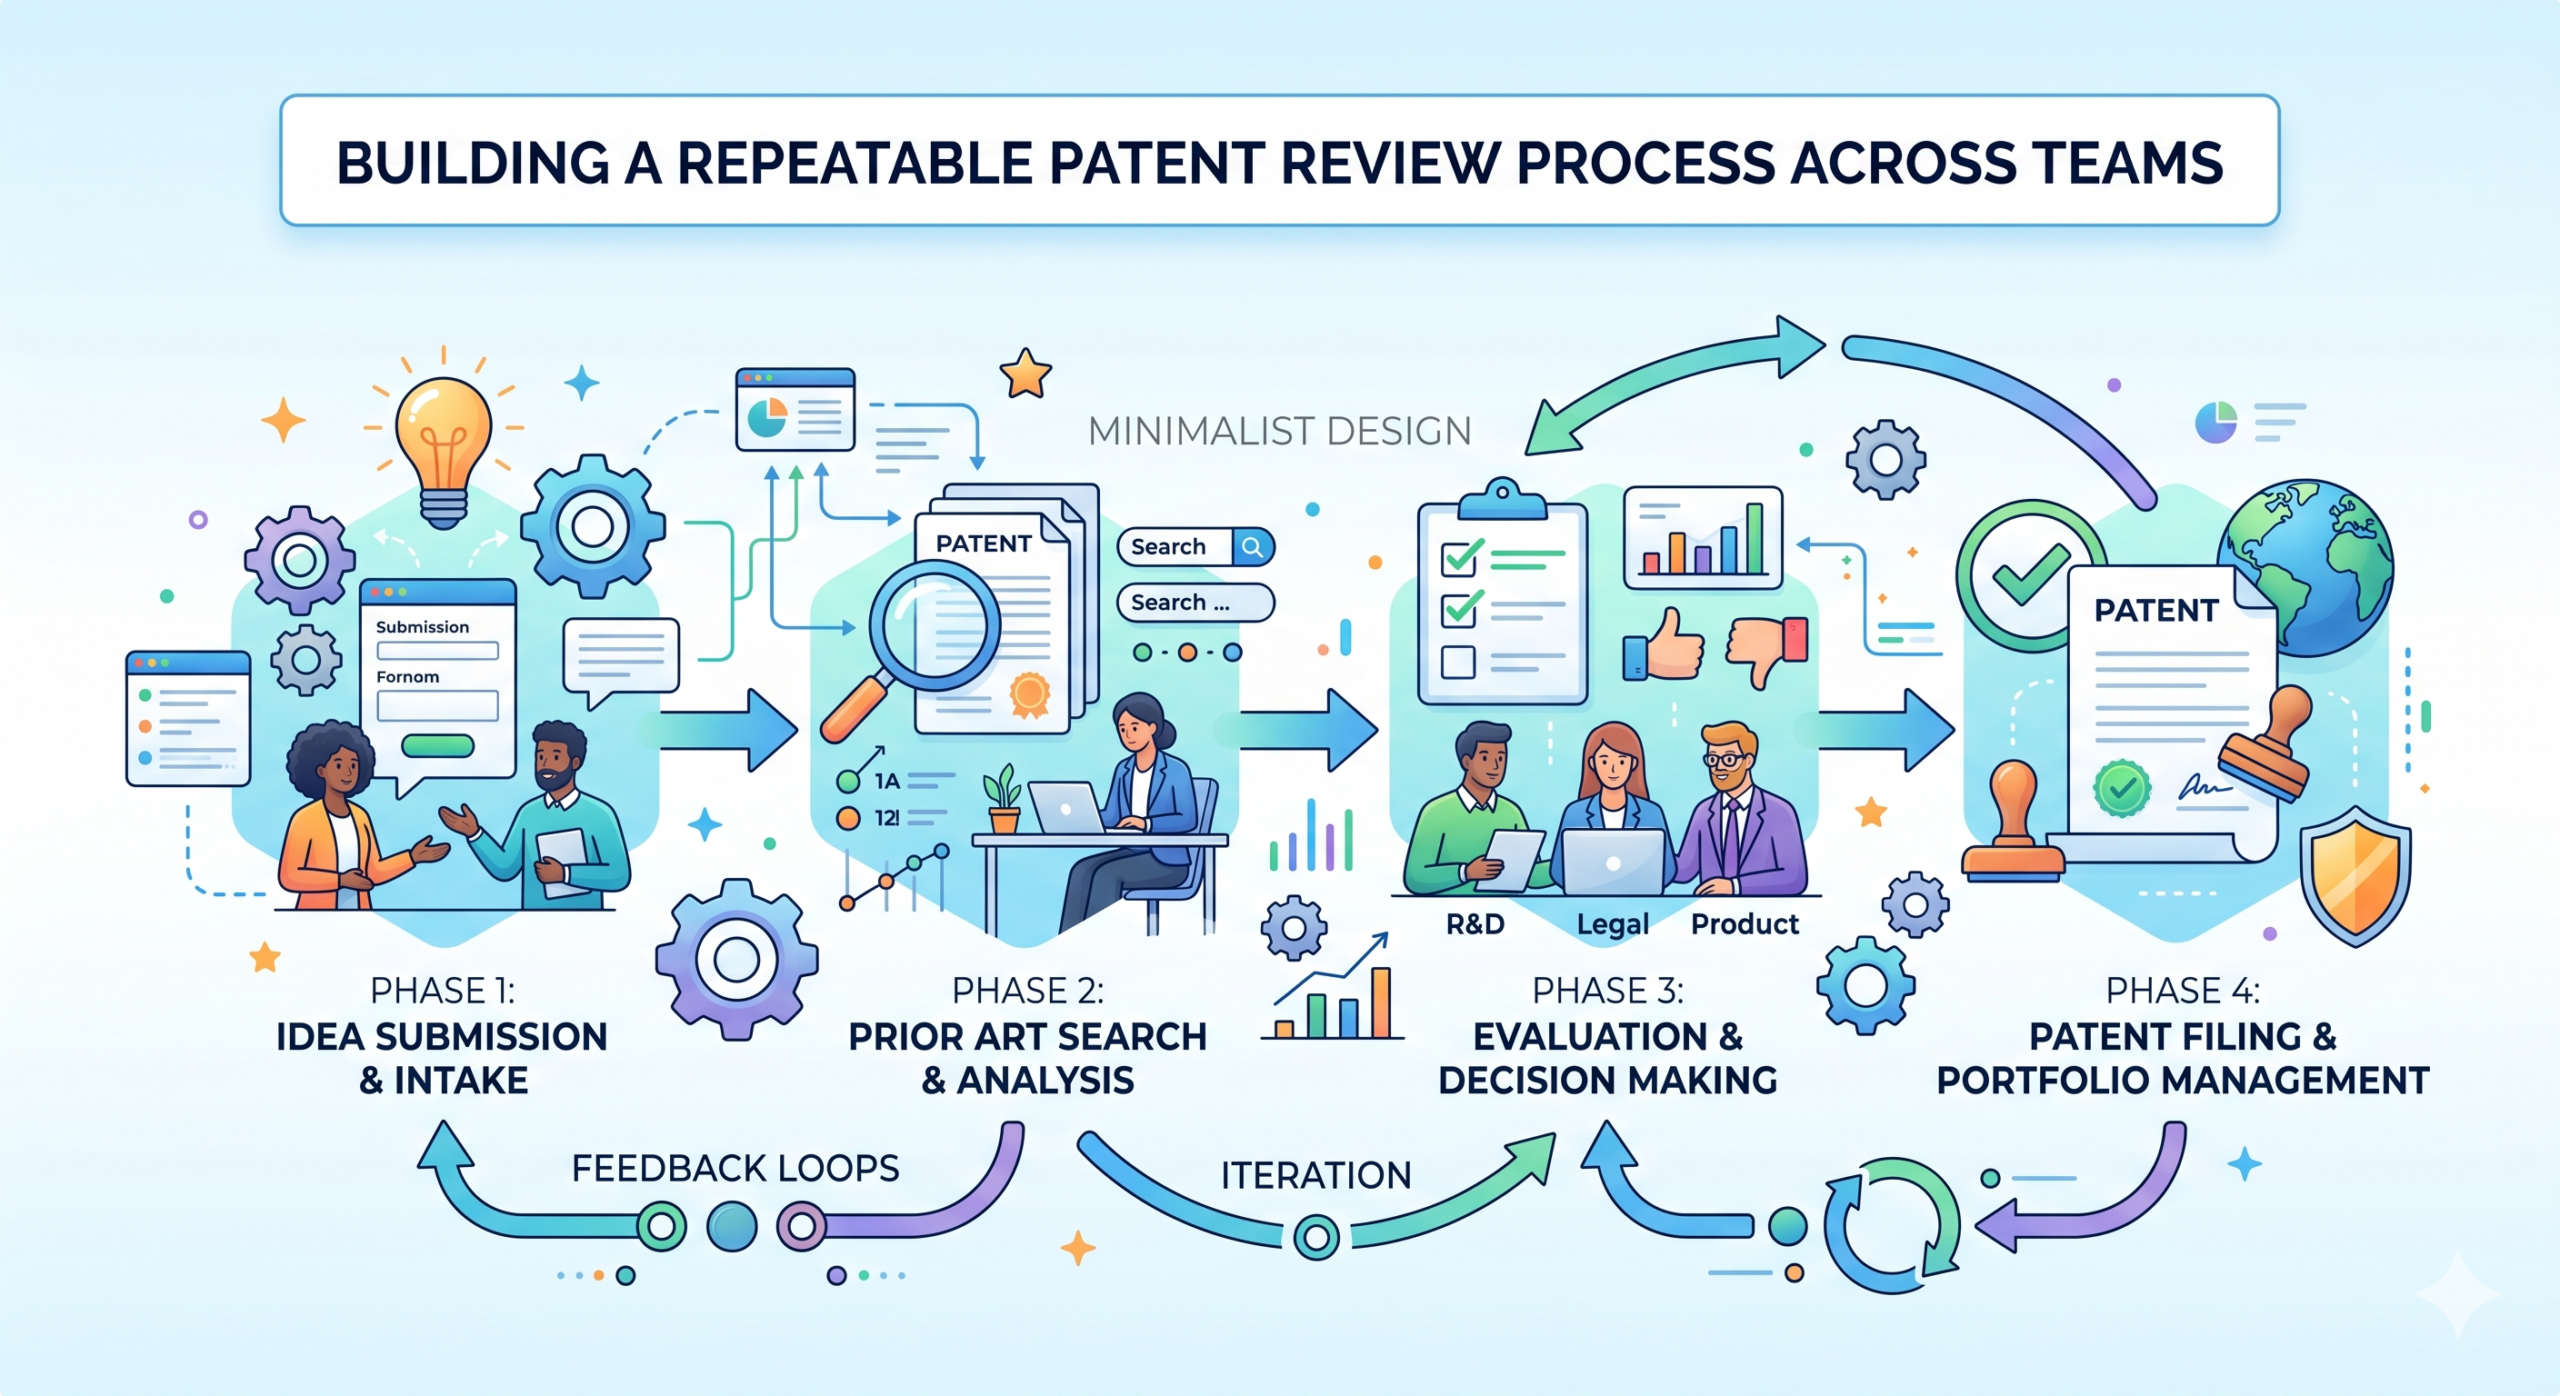
How to Build a Repeatable Patent Review Process Across Teams
A patent review should not feel like a fire drill. PowerPatent helps teams do this with smart software, guided workflows, and real patent attorney oversight, so founders can protect what they are building with more speed and confidence. You can see how it works here: https://powerpatent.com/how-it-works Why Patent Review Breaks Down Across Teams Patent review…
-
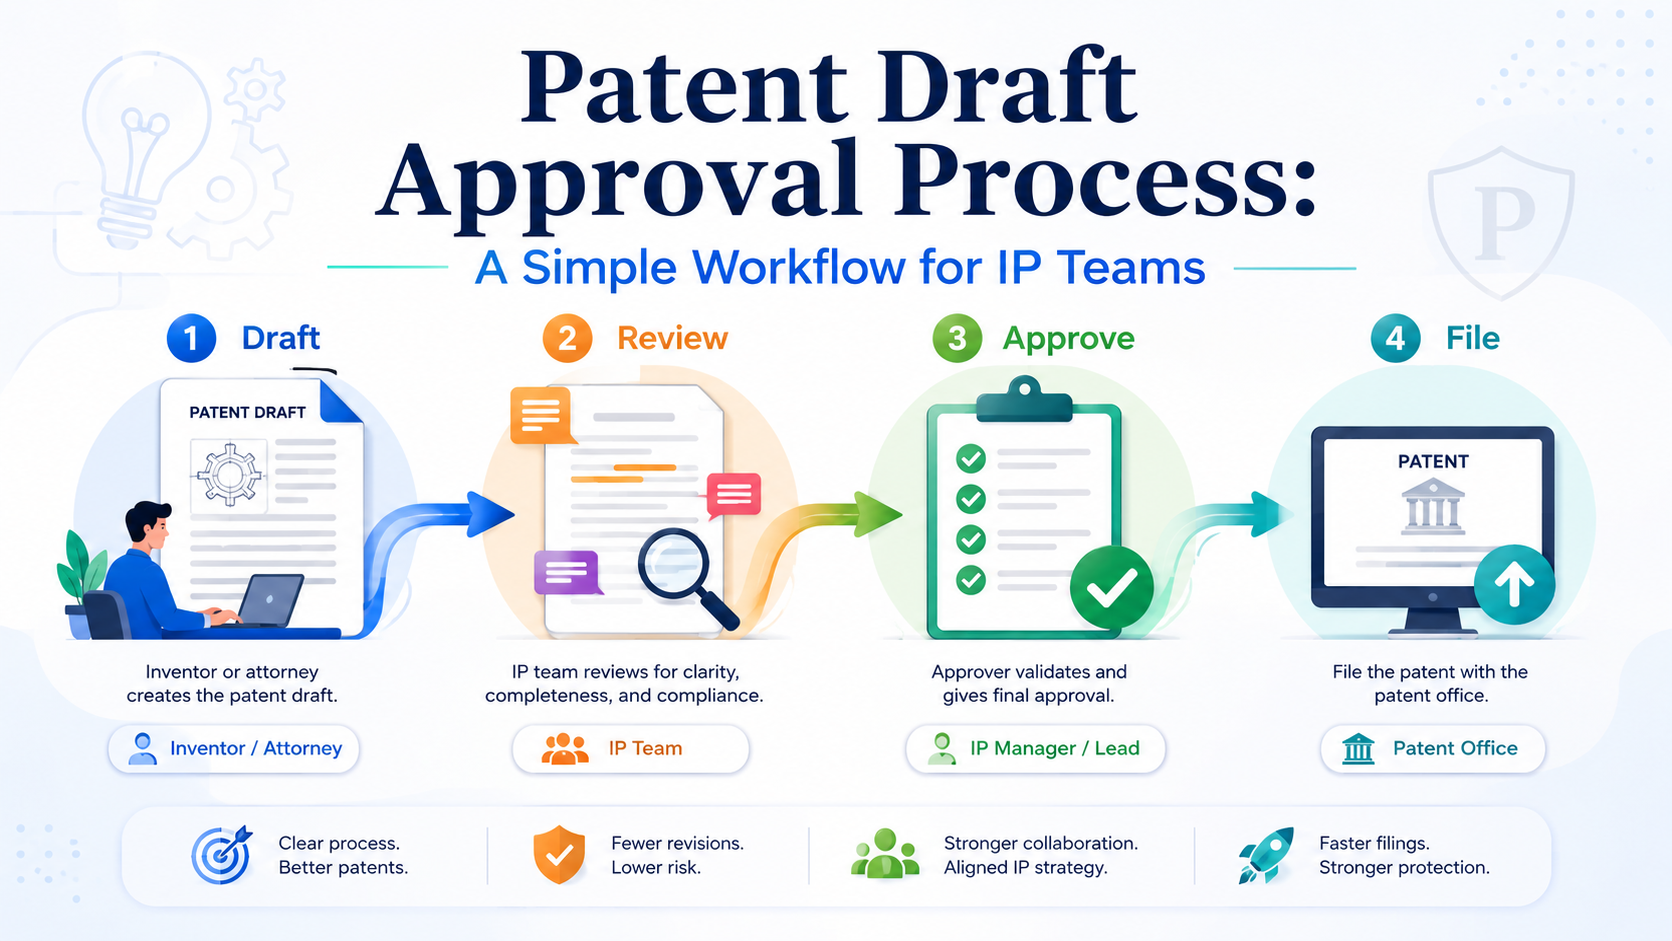
Patent Draft Approval Process: A Simple Workflow for IP Teams
A strong patent draft should not feel like a mystery box. Your IP team should know what was invented, why it matters, what the draft protects, who must review it, what changes are needed, and when the draft is ready to file. When that flow is unclear, teams lose time. Engineers get pulled into long…
-

How AI Helps Inventors and Attorneys Work Together Faster
Inventors move fast. Attorneys need to be careful. That gap can slow a patent down before it even starts. A founder may have the idea in their head, the code in a repo, a rough sketch on a whiteboard, and a few notes in Slack. A patent attorney needs that same idea in clear words,…
-
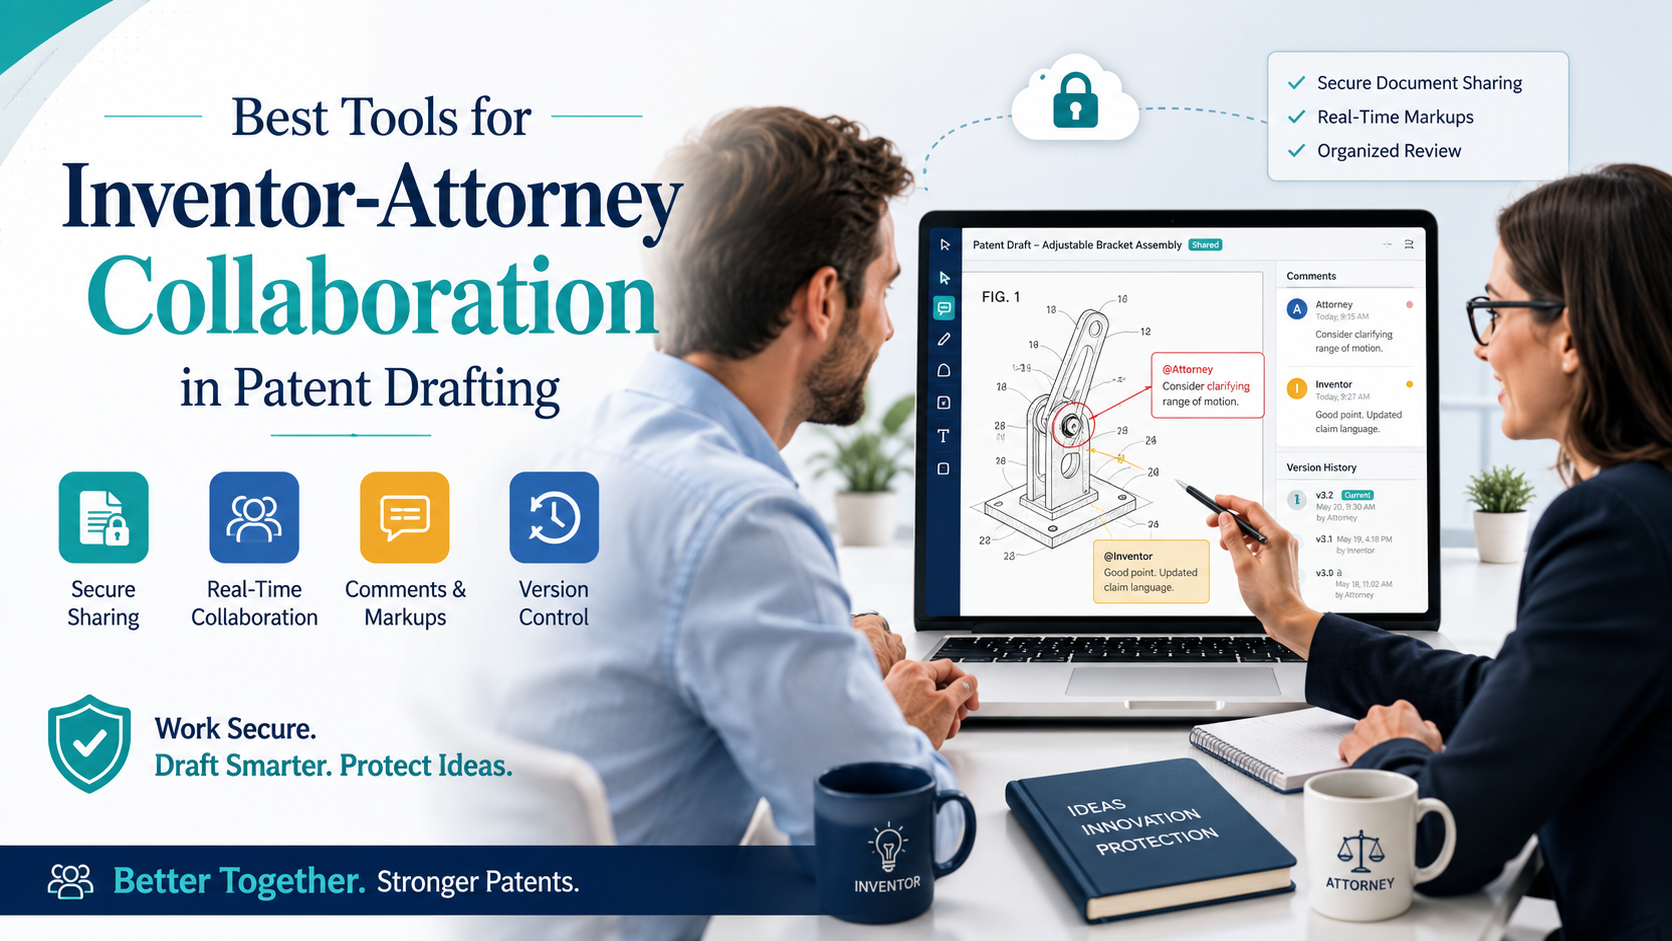
Best Tools for Inventor-Attorney Collaboration in Patent Drafting
Patent drafting works best when inventors and attorneys build the application together. The inventor knows the idea deeply. The attorney knows how to turn that idea into strong patent language. But when the work happens through scattered emails, messy notes, lost drawings, long calls, and late feedback, good ideas can get weak fast. The Best…
-
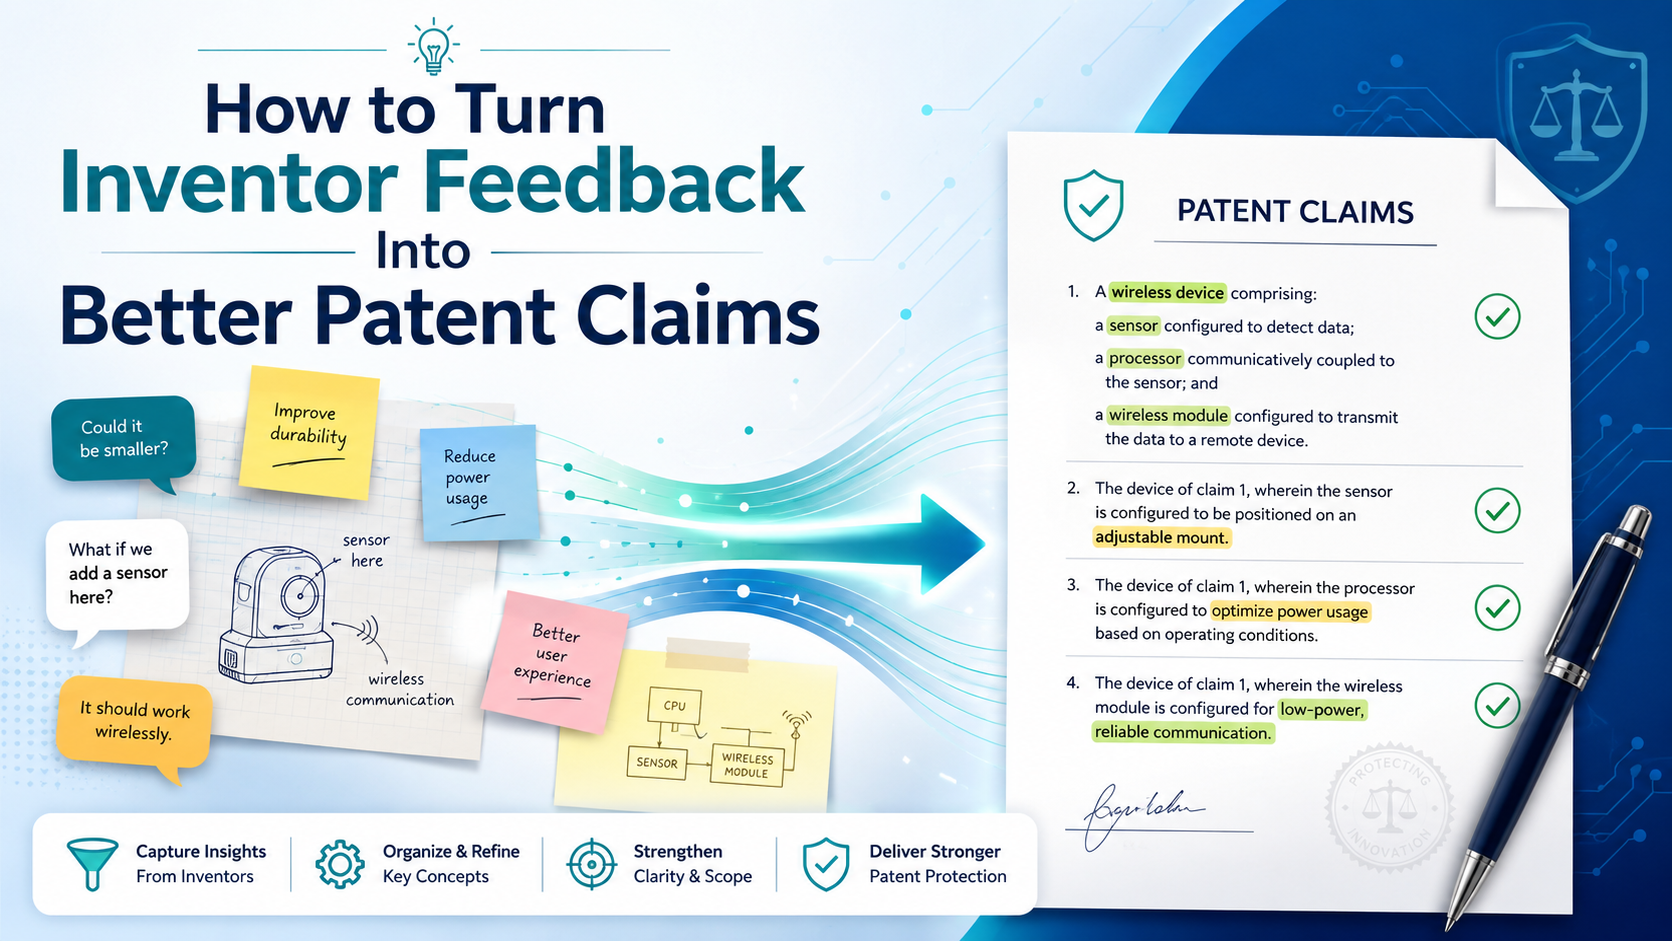
How to Turn Inventor Feedback Into Better Patent Claims
Inventor feedback is one of the most useful parts of building strong patent claims. Yet many teams treat it like a side note. That is a mistake. At PowerPatent, we help teams move from raw invention notes to strong patent filings with smart software and real attorney oversight. You can see how that process works…
-

Patent Collaboration Software: What Law Firms Should Look For
Patent work has changed. Clients move faster. Inventors expect clear updates. Teams are often spread across offices, homes, and time zones. A single patent matter may touch an attorney, a patent agent, a paralegal, an inventor, a reviewer, and sometimes a founder who wants answers now. To see how PowerPatent helps firms and founders move…